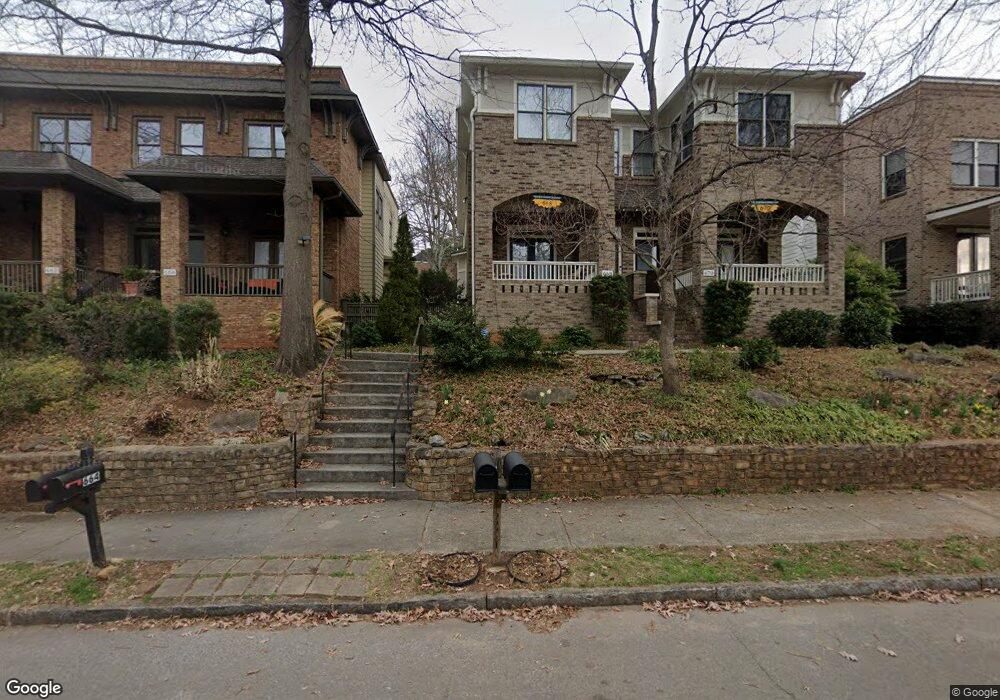
668 Mercer St SE Unit 3 Atlanta, GA 30312
Grant Park NeighborhoodEstimated Value: $598,076 - $682,000
3
Beds
3
Baths
2,090
Sq Ft
$309/Sq Ft
Est. Value
About This Home
This home is located at 668 Mercer St SE Unit 3, Atlanta, GA 30312 and is currently estimated at $646,019, approximately $309 per square foot. 668 Mercer St SE Unit 3 is a home located in Fulton County with nearby schools including Parkside Elementary School, King Middle School, and Maynard Holbrook Jackson High School.
Ownership History
Date
Name
Owned For
Owner Type
Purchase Details
Closed on
Jun 21, 2024
Sold by
Hom Stephen
Bought by
Gunnison Samantha L
Current Estimated Value
Home Financials for this Owner
Home Financials are based on the most recent Mortgage that was taken out on this home.
Original Mortgage
$509,840
Outstanding Balance
$503,233
Interest Rate
6.94%
Mortgage Type
New Conventional
Estimated Equity
$142,786
Purchase Details
Closed on
May 31, 2018
Sold by
Erath Richard
Bought by
Hom Stephen and Hom Cameron
Home Financials for this Owner
Home Financials are based on the most recent Mortgage that was taken out on this home.
Original Mortgage
$376,000
Interest Rate
4.5%
Mortgage Type
New Conventional
Purchase Details
Closed on
Jul 25, 2017
Sold by
Toulme Nill V
Bought by
Erath Richard and Weber Laura
Home Financials for this Owner
Home Financials are based on the most recent Mortgage that was taken out on this home.
Original Mortgage
$374,300
Interest Rate
3.88%
Mortgage Type
New Conventional
Create a Home Valuation Report for This Property
The Home Valuation Report is an in-depth analysis detailing your home's value as well as a comparison with similar homes in the area
Home Values in the Area
Average Home Value in this Area
Purchase History
| Date | Buyer | Sale Price | Title Company |
|---|---|---|---|
| Gunnison Samantha L | $637,300 | -- | |
| Hom Stephen | $475,000 | -- | |
| Erath Richard | $394,000 | -- |
Source: Public Records
Mortgage History
| Date | Status | Borrower | Loan Amount |
|---|---|---|---|
| Open | Gunnison Samantha L | $509,840 | |
| Previous Owner | Hom Stephen | $376,000 | |
| Previous Owner | Erath Richard | $374,300 |
Source: Public Records
Tax History Compared to Growth
Tax History
| Year | Tax Paid | Tax Assessment Tax Assessment Total Assessment is a certain percentage of the fair market value that is determined by local assessors to be the total taxable value of land and additions on the property. | Land | Improvement |
|---|---|---|---|---|
| 2025 | $5,856 | $257,200 | $56,640 | $200,560 |
| 2023 | $10,648 | $257,200 | $56,640 | $200,560 |
| 2022 | $5,843 | $210,000 | $53,080 | $156,920 |
| 2021 | $5,795 | $210,000 | $53,080 | $156,920 |
| 2020 | $5,301 | $221,080 | $53,080 | $168,000 |
| 2019 | $479 | $190,000 | $45,400 | $144,600 |
| 2018 | $6,525 | $157,600 | $17,400 | $140,200 |
| 2017 | $5,400 | $125,040 | $17,880 | $107,160 |
| 2016 | $5,414 | $125,040 | $17,880 | $107,160 |
| 2015 | $5,428 | $125,040 | $17,880 | $107,160 |
| 2014 | $5,669 | $125,040 | $17,880 | $107,160 |
Source: Public Records
Map
Nearby Homes
- 634 Berne St SE
- 726 Eloise St SE
- 778 Rosedale Ave SE
- 614 Delmar Ave SE
- 767 Ormewood Ave SE
- 816 Berne St SE Unit 5
- 816 Berne St SE Unit 4
- 642 Grant Ave SE
- 495 Waldo St SE
- 705 Glenwood Ave SE
- 899 Delmar Ave SE
- 704 Beltloop
- 824 Delmar Ct SE
- 840 United Ave SE Unit 212
- 840 United Ave SE Unit 205
- 840 United Ave SE Unit 305
- 840 United Ave SE Unit 106
- 668 Mercer St SE
- 670 Mercer St SE
- 664 Mercer St SE Unit A
- 664 Mercer St SE Unit 2
- 664 Mercer St SE Unit 664
- 672 Mercer St SE
- 662 Mercer St SE Unit 1
- 674 Mercer St SE
- 650 Mercer St SE
- 676 Mercer St SE Unit 676
- 676 Mercer St SE
- 661 Berne St SE
- 665 Berne St SE
- 678 Mercer St SE
- 678 Mercer St SE Unit 678
- 655 Berne St SE
- 669 Berne St SE
- 649 Berne St SE
- 673 Berne St SE
- 679 Berne St SE