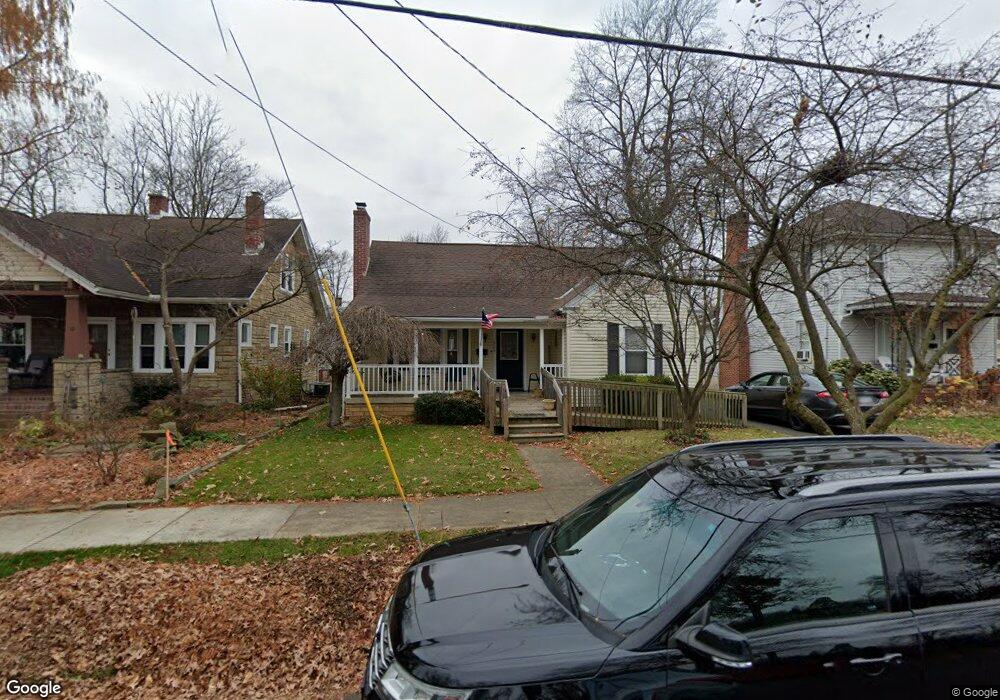
668 N Grant St Wooster, OH 44691
Estimated Value: $188,000 - $239,000
4
Beds
2
Baths
1,669
Sq Ft
$122/Sq Ft
Est. Value
About This Home
This home is located at 668 N Grant St, Wooster, OH 44691 and is currently estimated at $203,602, approximately $121 per square foot. 668 N Grant St is a home located in Wayne County with nearby schools including Cornerstone Elementary School, Edgewood Middle School, and Wooster High School.
Ownership History
Date
Name
Owned For
Owner Type
Purchase Details
Closed on
May 16, 2005
Sold by
Gaus Tyler K
Bought by
Thaxton Ross
Current Estimated Value
Home Financials for this Owner
Home Financials are based on the most recent Mortgage that was taken out on this home.
Original Mortgage
$70,000
Interest Rate
6.05%
Mortgage Type
Fannie Mae Freddie Mac
Purchase Details
Closed on
Jul 25, 2003
Sold by
Hand James J and Hand Sue E
Bought by
Gaus Tyler K
Home Financials for this Owner
Home Financials are based on the most recent Mortgage that was taken out on this home.
Original Mortgage
$116,000
Interest Rate
5.3%
Mortgage Type
Unknown
Purchase Details
Closed on
Aug 13, 1990
Sold by
Corriveau John and Corriveau Molly S
Bought by
Smith Robert R and Smith Candace
Purchase Details
Closed on
Jun 3, 1987
Bought by
Corriveau John and Corriveau Molly S
Create a Home Valuation Report for This Property
The Home Valuation Report is an in-depth analysis detailing your home's value as well as a comparison with similar homes in the area
Home Values in the Area
Average Home Value in this Area
Purchase History
| Date | Buyer | Sale Price | Title Company |
|---|---|---|---|
| Thaxton Ross | $119,000 | Fidelity Title | |
| Gaus Tyler K | $116,000 | -- | |
| Smith Robert R | $58,500 | -- | |
| Corriveau John | $50,000 | -- |
Source: Public Records
Mortgage History
| Date | Status | Borrower | Loan Amount |
|---|---|---|---|
| Closed | Thaxton Ross | $70,000 | |
| Previous Owner | Gaus Tyler K | $116,000 |
Source: Public Records
Tax History Compared to Growth
Tax History
| Year | Tax Paid | Tax Assessment Tax Assessment Total Assessment is a certain percentage of the fair market value that is determined by local assessors to be the total taxable value of land and additions on the property. | Land | Improvement |
|---|---|---|---|---|
| 2024 | $1,850 | $52,230 | $13,550 | $38,680 |
| 2023 | $1,762 | $52,230 | $13,550 | $38,680 |
| 2022 | $1,742 | $42,120 | $10,930 | $31,190 |
| 2021 | $1,797 | $42,120 | $10,930 | $31,190 |
| 2020 | $1,704 | $42,120 | $10,930 | $31,190 |
| 2019 | $1,523 | $37,390 | $10,550 | $26,840 |
| 2018 | $1,527 | $37,390 | $10,550 | $26,840 |
| 2017 | $1,519 | $37,390 | $10,550 | $26,840 |
| 2016 | $1,567 | $35,950 | $10,140 | $25,810 |
| 2015 | $1,538 | $35,950 | $10,140 | $25,810 |
| 2014 | $1,539 | $35,950 | $10,140 | $25,810 |
| 2013 | $1,809 | $31,600 | $12,120 | $19,480 |
Source: Public Records
Map
Nearby Homes
- 143 Park Ave
- 537 N Grant St
- 450 N Grant St
- 534 N Buckeye St
- 406 N Walnut St
- 900 Quinby Ave
- 423 N Market St
- 412 Emerick St
- 657 N Bever St
- 323 N Grant St
- 429 Woodland Ave
- 329 E Bowman St
- 336 Spring St
- 227 N Walnut St
- 229 N Walnut St
- 349 W North St
- 1117 Quinby Ave
- 1123 Quinby Ave
- 548 Spring St
- 554 Nold Ave