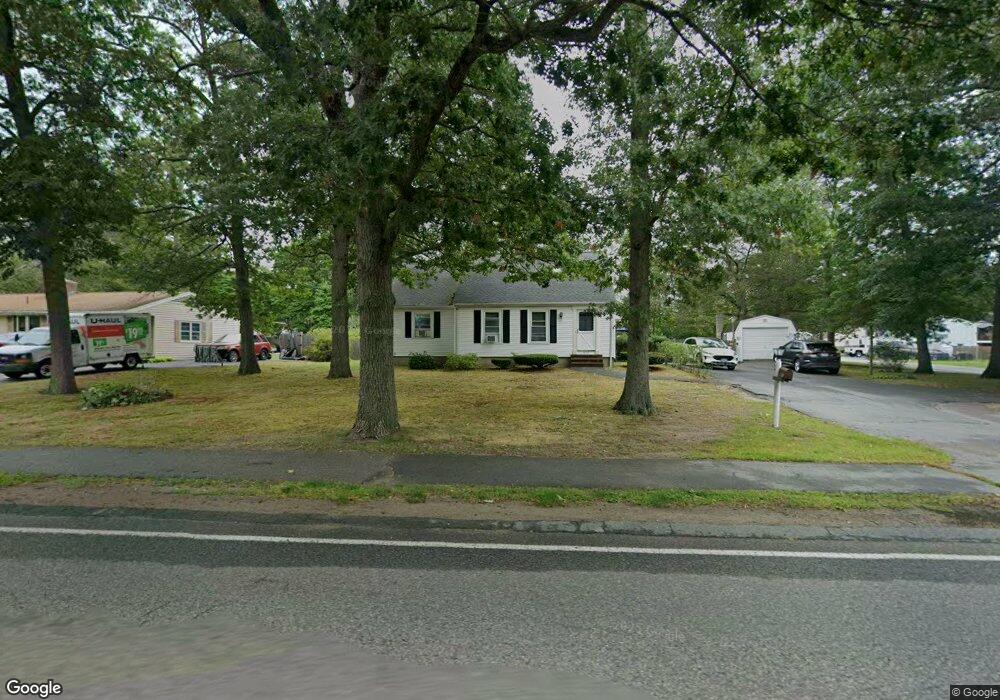
668 Plain St Brockton, MA 02302
Estimated Value: $507,000 - $586,000
4
Beds
2
Baths
1,862
Sq Ft
$296/Sq Ft
Est. Value
About This Home
This home is located at 668 Plain St, Brockton, MA 02302 and is currently estimated at $551,132, approximately $295 per square foot. 668 Plain St is a home located in Plymouth County with nearby schools including Davis K-8 School, John F. Kennedy Elementary School, and South Middle School.
Ownership History
Date
Name
Owned For
Owner Type
Purchase Details
Closed on
Jul 3, 2003
Sold by
Gillis Phyllis E
Bought by
Lynch John F and Lynch Ellen Joan
Current Estimated Value
Home Financials for this Owner
Home Financials are based on the most recent Mortgage that was taken out on this home.
Original Mortgage
$150,000
Outstanding Balance
$64,733
Interest Rate
5.46%
Mortgage Type
Purchase Money Mortgage
Estimated Equity
$486,399
Purchase Details
Closed on
Oct 6, 1988
Sold by
Seitsinger Roy M
Bought by
Gillis John C
Create a Home Valuation Report for This Property
The Home Valuation Report is an in-depth analysis detailing your home's value as well as a comparison with similar homes in the area
Home Values in the Area
Average Home Value in this Area
Purchase History
| Date | Buyer | Sale Price | Title Company |
|---|---|---|---|
| Lynch John F | $250,000 | -- | |
| Gillis John C | $157,900 | -- |
Source: Public Records
Mortgage History
| Date | Status | Borrower | Loan Amount |
|---|---|---|---|
| Open | Gillis John C | $22,000 | |
| Open | Gillis John C | $150,000 | |
| Previous Owner | Gillis John C | $88,600 | |
| Previous Owner | Gillis John C | $10,000 |
Source: Public Records
Tax History Compared to Growth
Tax History
| Year | Tax Paid | Tax Assessment Tax Assessment Total Assessment is a certain percentage of the fair market value that is determined by local assessors to be the total taxable value of land and additions on the property. | Land | Improvement |
|---|---|---|---|---|
| 2025 | $5,338 | $440,800 | $162,800 | $278,000 |
| 2024 | $5,130 | $426,800 | $162,800 | $264,000 |
| 2023 | $5,684 | $437,900 | $113,200 | $324,700 |
| 2022 | $5,295 | $379,000 | $102,900 | $276,100 |
| 2021 | $5,129 | $353,700 | $96,400 | $257,300 |
| 2020 | $4,748 | $313,400 | $84,200 | $229,200 |
| 2019 | $4,667 | $300,300 | $80,800 | $219,500 |
| 2018 | $4,063 | $253,000 | $80,800 | $172,200 |
| 2017 | $4,020 | $249,700 | $80,800 | $168,900 |
| 2016 | $3,892 | $224,200 | $77,000 | $147,200 |
| 2015 | $3,545 | $195,300 | $77,000 | $118,300 |
| 2014 | $3,423 | $188,800 | $77,000 | $111,800 |
Source: Public Records
Map
Nearby Homes