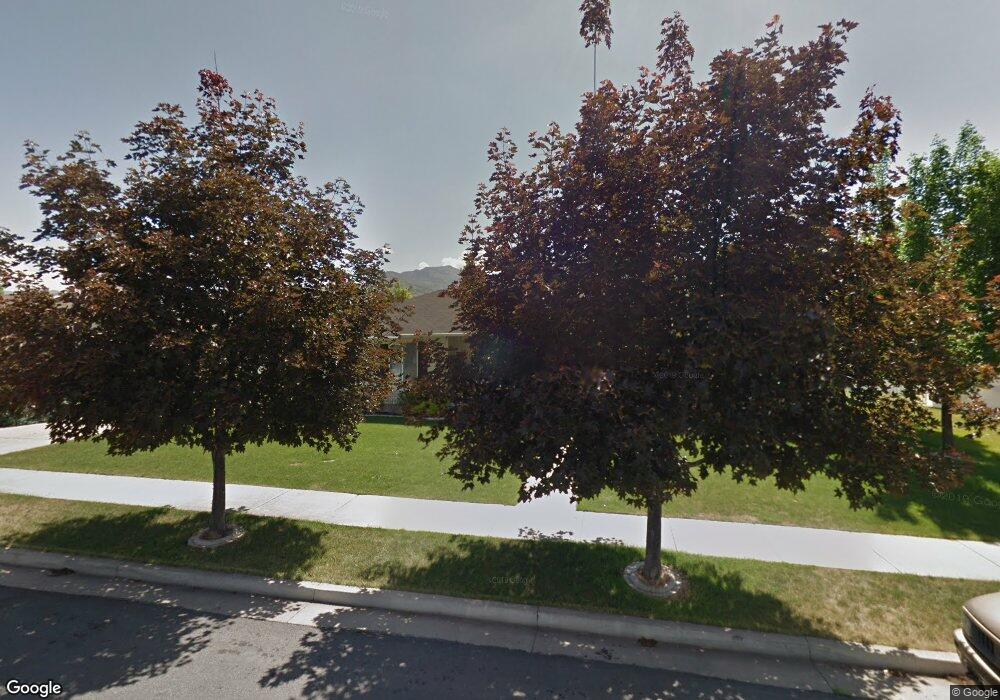
668 S 180 E Unit 23 Smithfield, UT 84335
Estimated Value: $369,000 - $505,000
Studio
--
Bath
1,238
Sq Ft
$353/Sq Ft
Est. Value
About This Home
This home is located at 668 S 180 E Unit 23, Smithfield, UT 84335 and is currently estimated at $436,400, approximately $352 per square foot. 668 S 180 E Unit 23 is a home located in Cache County with nearby schools including Summit School, Cedar Ridge School, and North Cache Middle School.
Ownership History
Date
Name
Owned For
Owner Type
Purchase Details
Closed on
Oct 24, 2024
Sold by
Barbara W Gutke Revocable Trust and Lundberg Marilyn
Bought by
Marilyn Gutke Living Trust and Gutke
Current Estimated Value
Purchase Details
Closed on
Jul 3, 2018
Sold by
Olson Ronald R and Olson Elizabeth J
Bought by
Gutke Barbara W and Barbara W Gutke Revocable Trust
Purchase Details
Closed on
Oct 2, 2017
Sold by
Rl Johnson Richard E
Bought by
Olson Ronald R and Loson Elizabeth
Purchase Details
Closed on
Feb 24, 2010
Sold by
Johnson Richard E and Johnson Elizabeth
Bought by
Johnson Richard E and Johsnon Elizabeth W
Create a Home Valuation Report for This Property
The Home Valuation Report is an in-depth analysis detailing your home's value as well as a comparison with similar homes in the area
Home Values in the Area
Average Home Value in this Area
Purchase History
| Date | Buyer | Sale Price | Title Company |
|---|---|---|---|
| Marilyn Gutke Living Trust | -- | None Listed On Document | |
| Gutke Barbara W | -- | None Available | |
| Olson Ronald R | -- | -- | |
| Johnson Richard E | -- | Cache Title Company | |
| Johnson Richard E | -- | Cache Title Company |
Source: Public Records
Tax History
| Year | Tax Paid | Tax Assessment Tax Assessment Total Assessment is a certain percentage of the fair market value that is determined by local assessors to be the total taxable value of land and additions on the property. | Land | Improvement |
|---|---|---|---|---|
| 2025 | $1,732 | $231,810 | $0 | $0 |
| 2024 | $2,043 | $256,525 | $0 | $0 |
| 2023 | $2,131 | $253,040 | $0 | $0 |
| 2022 | $2,166 | $253,045 | $0 | $0 |
| 2021 | $2,140 | $382,060 | $70,000 | $312,060 |
| 2020 | $1,642 | $273,412 | $70,000 | $203,412 |
| 2019 | $1,590 | $252,412 | $49,000 | $203,412 |
| 2018 | $1,471 | $225,880 | $49,000 | $176,880 |
| 2017 | $1,376 | $115,390 | $0 | $0 |
| 2016 | $1,400 | $115,390 | $0 | $0 |
| 2015 | $1,188 | $97,540 | $0 | $0 |
| 2014 | $1,168 | $97,815 | $0 | $0 |
| 2013 | -- | $97,815 | $0 | $0 |
Source: Public Records
Map
Nearby Homes
Your Personal Tour Guide
Ask me questions while you tour the home.