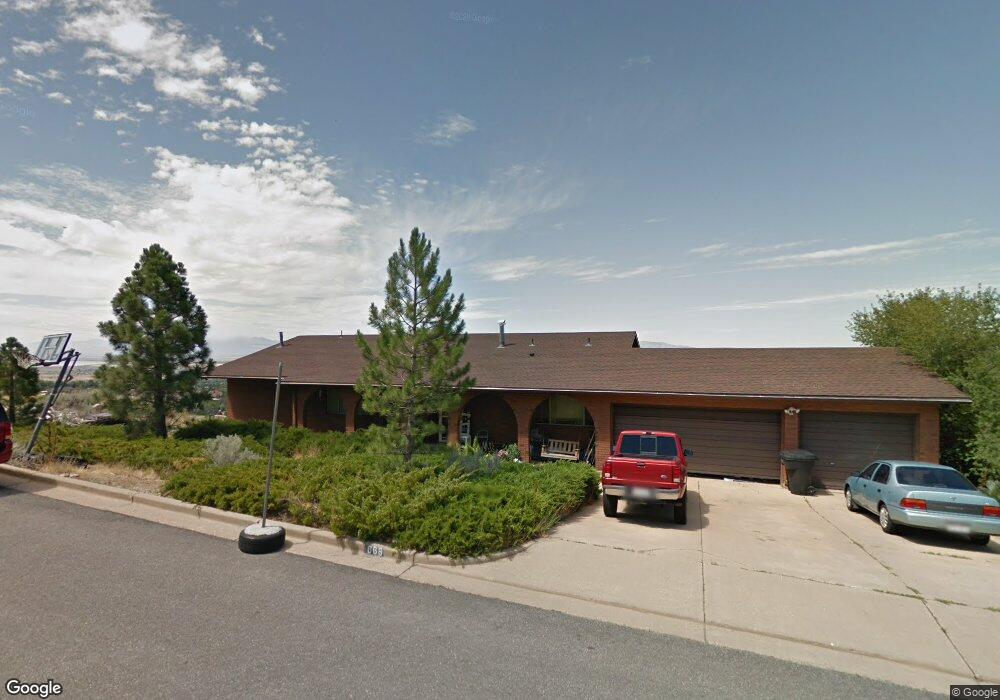
668 S 1800 E Kaysville, UT 84037
Estimated Value: $703,000 - $784,000
4
Beds
3
Baths
1,809
Sq Ft
$403/Sq Ft
Est. Value
About This Home
This home is located at 668 S 1800 E, Kaysville, UT 84037 and is currently estimated at $728,979, approximately $402 per square foot. 668 S 1800 E is a home located in Davis County with nearby schools including Morgan Elementary School, Fairfield Junior High School, and Davis High School.
Ownership History
Date
Name
Owned For
Owner Type
Purchase Details
Closed on
Nov 19, 2020
Sold by
Hartmann Andrew Ralph and Hartmann Darla K
Bought by
Hartmann Andrew R and Hartmann Darla
Current Estimated Value
Home Financials for this Owner
Home Financials are based on the most recent Mortgage that was taken out on this home.
Original Mortgage
$386,000
Outstanding Balance
$343,485
Interest Rate
2.8%
Mortgage Type
New Conventional
Estimated Equity
$385,494
Purchase Details
Closed on
Jul 31, 2020
Sold by
Hartmann Andrew Ralph and Hartmann Darla
Bought by
Hartmann Andrew R and Hartmann Darla K
Purchase Details
Closed on
Oct 16, 2017
Sold by
Hartmann Andrew R
Bought by
Hartmann Andrew Ralph and Hartmann Darla Hartmann
Purchase Details
Closed on
Nov 1, 2000
Sold by
Olson Mary L
Bought by
Hartmann Andrew R
Home Financials for this Owner
Home Financials are based on the most recent Mortgage that was taken out on this home.
Original Mortgage
$193,600
Interest Rate
7.9%
Create a Home Valuation Report for This Property
The Home Valuation Report is an in-depth analysis detailing your home's value as well as a comparison with similar homes in the area
Home Values in the Area
Average Home Value in this Area
Purchase History
| Date | Buyer | Sale Price | Title Company |
|---|---|---|---|
| Hartmann Andrew R | -- | Accommodation | |
| Hartmann Andrew Ralph | -- | First American Title Ins Co | |
| Hartmann Andrew R | -- | None Available | |
| Hartmann Andrew Ralph | -- | -- | |
| Hartmann Andrew R | -- | First American Title Co |
Source: Public Records
Mortgage History
| Date | Status | Borrower | Loan Amount |
|---|---|---|---|
| Open | Hartmann Andrew Ralph | $386,000 | |
| Closed | Hartmann Andrew R | $193,600 |
Source: Public Records
Tax History Compared to Growth
Tax History
| Year | Tax Paid | Tax Assessment Tax Assessment Total Assessment is a certain percentage of the fair market value that is determined by local assessors to be the total taxable value of land and additions on the property. | Land | Improvement |
|---|---|---|---|---|
| 2025 | $3,538 | $374,550 | $195,092 | $179,458 |
| 2024 | $3,538 | $362,450 | $192,809 | $169,641 |
| 2023 | $3,430 | $637,000 | $196,374 | $440,626 |
| 2022 | $3,635 | $368,501 | $108,675 | $259,826 |
| 2021 | $2,996 | $459,000 | $160,381 | $298,619 |
| 2020 | $2,695 | $400,000 | $135,867 | $264,133 |
| 2019 | $2,634 | $386,000 | $132,577 | $253,423 |
| 2018 | $2,499 | $361,000 | $125,842 | $235,158 |
| 2016 | $2,330 | $175,340 | $64,418 | $110,922 |
| 2015 | $2,364 | $169,180 | $64,418 | $104,762 |
| 2014 | $2,000 | $151,713 | $63,798 | $87,915 |
| 2013 | -- | $150,177 | $60,107 | $90,070 |
Source: Public Records
Map
Nearby Homes
- 570 S 1800 E
- 652 Cherry Ln
- 358 S Eastoaks Dr
- 1419 E Heights Way Unit 15
- 1543 Mirabella Way Unit 21
- 399 Stirling Dr E
- 362 Glen Cir
- 1351 E 400 S
- 2076 Summerwood Dr
- 1469 E Carrie Dr
- 1043 S Oxford Cir
- 1668 N 400 W
- 1779 250 N Unit 29-R
- 1730 250 N Unit 23-R
- 1616 250 N Unit 26-R
- 960 E Par Three Cir
- 947 S Honeysuckle Way
- 947 E Green Rd
- 277 W Overlook Ct Unit 6
- 1563 N Compton Rd
- 652 S 1800 E
- 669 Eastoaks Dr
- 636 S 1800 E
- 655 Eastoaks Dr
- 618 S 1800 E
- 633 S Eastoaks Dr
- 633 Eastoaks Dr
- 604 S 1800 E
- 605 Eastoaks Dr
- 672 Eastoaks Dr
- 658 S Eastoaks Dr
- 658 Eastoaks Dr
- 584 S 1800 E
- 636 Eastoaks Dr
- 587 S Eastoaks Dr
- 587 S Eastoaks Dr
- 602 Eastoaks Dr
- 576 S 1800 E
- 576 S 1800 E Unit 34
- 677 Vista Dr