Estimated Value: $91,000 - $145,000
2
Beds
1
Bath
924
Sq Ft
$118/Sq Ft
Est. Value
About This Home
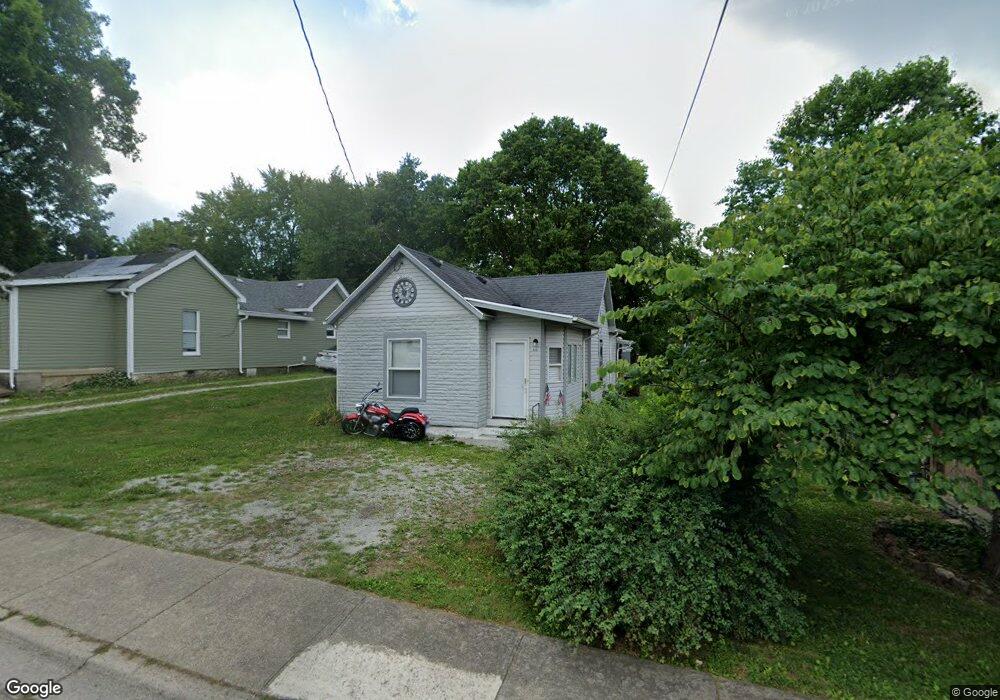
This home is located at 668 S Columbus St, Xenia, OH 45385 and is currently estimated at $109,031, approximately $117 per square foot. 668 S Columbus St is a home located in Greene County with nearby schools including Xenia High School, Summit Academy Community School for Alternative Learners - Xenia, and Legacy Christian Academy.
Ownership History
Date
Name
Owned For
Owner Type
Purchase Details
Closed on
Dec 17, 2004
Sold by
Estate Of Thomas E Buschbaum
Bought by
Ford Christopher
Current Estimated Value
Home Financials for this Owner
Home Financials are based on the most recent Mortgage that was taken out on this home.
Original Mortgage
$44,304
Outstanding Balance
$22,350
Interest Rate
5.84%
Mortgage Type
FHA
Estimated Equity
$86,681
Purchase Details
Closed on
Aug 10, 2001
Sold by
Ameriquest Mtg Company
Bought by
Buschbaum Thomas E
Purchase Details
Closed on
Oct 19, 2000
Sold by
Ferguson Steven L and Ferguson Sorrell L
Bought by
Norwest Bank Minnesota Na and Amresco Residential Securities Corp
Purchase Details
Closed on
Oct 10, 2000
Sold by
Ferguson Steven L
Bought by
Ameriquest Mtg Company and Norwest Bank Minnesota Na
Purchase Details
Closed on
Nov 21, 1997
Sold by
High Yield Investment In
Bought by
Ferguson Steven L and Ferguson Sorrell L
Create a Home Valuation Report for This Property
The Home Valuation Report is an in-depth analysis detailing your home's value as well as a comparison with similar homes in the area
Home Values in the Area
Average Home Value in this Area
Purchase History
| Date | Buyer | Sale Price | Title Company |
|---|---|---|---|
| Ford Christopher | $45,000 | -- | |
| Buschbaum Thomas E | $23,000 | -- | |
| Norwest Bank Minnesota Na | $22,000 | -- | |
| Ameriquest Mtg Company | $22,000 | -- | |
| Ferguson Steven L | $40,500 | -- |
Source: Public Records
Mortgage History
| Date | Status | Borrower | Loan Amount |
|---|---|---|---|
| Open | Ford Christopher | $44,304 |
Source: Public Records
Tax History Compared to Growth
Tax History
| Year | Tax Paid | Tax Assessment Tax Assessment Total Assessment is a certain percentage of the fair market value that is determined by local assessors to be the total taxable value of land and additions on the property. | Land | Improvement |
|---|---|---|---|---|
| 2024 | $901 | $21,610 | $6,000 | $15,610 |
| 2023 | $901 | $21,610 | $6,000 | $15,610 |
| 2022 | $800 | $16,360 | $4,800 | $11,560 |
| 2021 | $811 | $16,360 | $4,800 | $11,560 |
| 2020 | $776 | $16,360 | $4,800 | $11,560 |
| 2019 | $737 | $14,630 | $3,940 | $10,690 |
| 2018 | $740 | $14,630 | $3,940 | $10,690 |
| 2017 | $713 | $14,630 | $3,940 | $10,690 |
| 2016 | $713 | $13,840 | $3,940 | $9,900 |
| 2015 | $715 | $13,840 | $3,940 | $9,900 |
| 2014 | $684 | $13,840 | $3,940 | $9,900 |
Source: Public Records
Map
Nearby Homes
- 660 S Columbus St
- 680 S Columbus St
- 688 S Columbus St
- 698 S Columbus St
- 677 S Columbus St
- 661 S Columbus St
- 710 S Columbus St
- 689 S Columbus St
- 653 S Columbus St
- 637 S Columbus St
- 612 S Columbus St
- 0 Murray Hill Dr
- 665 Kennedy St
- 651 Kennedy St
- 689 Kennedy St
- 589 Murray Hill Dr
- 554 Cottage Grove Ave
- 641 Kennedy St
- 695 Kennedy St
- 648 Eavey St