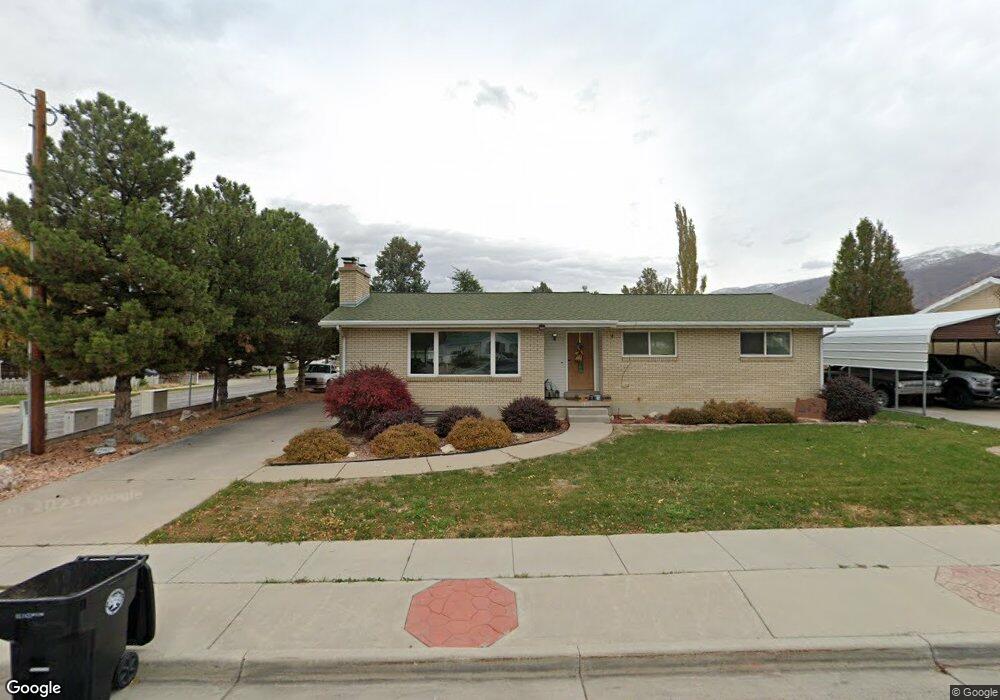
668 W 1000 N West Bountiful, UT 84087
Estimated Value: $553,000 - $640,000
5
Beds
3
Baths
2,754
Sq Ft
$221/Sq Ft
Est. Value
About This Home
This home is located at 668 W 1000 N, West Bountiful, UT 84087 and is currently estimated at $607,782, approximately $220 per square foot. 668 W 1000 N is a home located in Davis County with nearby schools including West Bountiful Elementary School, Bountiful Junior High School, and Viewmont High School.
Ownership History
Date
Name
Owned For
Owner Type
Purchase Details
Closed on
Jul 7, 2023
Sold by
Vobora Adam and Dunn Nicole
Bought by
Vobora Adam and Vobora Nicole
Current Estimated Value
Purchase Details
Closed on
May 28, 2021
Sold by
Vobora Adam
Bought by
Vobora Adam and Dunn Nicole
Home Financials for this Owner
Home Financials are based on the most recent Mortgage that was taken out on this home.
Original Mortgage
$499,780
Interest Rate
3%
Mortgage Type
FHA
Create a Home Valuation Report for This Property
The Home Valuation Report is an in-depth analysis detailing your home's value as well as a comparison with similar homes in the area
Home Values in the Area
Average Home Value in this Area
Purchase History
| Date | Buyer | Sale Price | Title Company |
|---|---|---|---|
| Vobora Adam | -- | 1St Liberty Title | |
| Vobora Adam | -- | Accommodation | |
| Vobora Adam | -- | Real Advantage Title | |
| Chaston William L | -- | Real Advantage Title |
Source: Public Records
Mortgage History
| Date | Status | Borrower | Loan Amount |
|---|---|---|---|
| Previous Owner | Vobora Adam | $499,780 |
Source: Public Records
Tax History Compared to Growth
Tax History
| Year | Tax Paid | Tax Assessment Tax Assessment Total Assessment is a certain percentage of the fair market value that is determined by local assessors to be the total taxable value of land and additions on the property. | Land | Improvement |
|---|---|---|---|---|
| 2025 | $3,592 | $312,950 | $140,367 | $172,583 |
| 2024 | $3,359 | $299,750 | $115,641 | $184,109 |
| 2023 | $3,212 | $526,000 | $217,247 | $308,753 |
| 2022 | $3,286 | $301,400 | $105,409 | $195,991 |
| 2021 | $2,799 | $392,000 | $144,459 | $247,541 |
| 2020 | $2,387 | $329,000 | $132,259 | $196,741 |
| 2019 | $2,413 | $330,000 | $132,050 | $197,950 |
| 2018 | $2,194 | $295,000 | $130,110 | $164,890 |
| 2016 | $1,738 | $126,500 | $36,150 | $90,350 |
| 2015 | $1,690 | $117,150 | $36,150 | $81,000 |
| 2014 | $1,565 | $111,650 | $36,150 | $75,500 |
| 2013 | -- | $100,796 | $32,391 | $68,405 |
Source: Public Records
Map
Nearby Homes
- 825 W 1320 N
- 790 N 500 W
- 637 W 1600 N
- 366 W 1000 N
- Lincoln Farmhouse Plan at Belmont Farms
- Belmont Traditional Plan at Belmont Farms
- Hampton Traditional Plan at Belmont Farms
- 340 N 500 W Unit 204
- 1503 N 300 W
- 767 W 220 N
- 399 W 400 N Unit 47
- 235 W 1400 N
- 1194 N 200 W
- 184 Park Shadows Cir
- 553 N 200 W
- 1260 N 200 W
- 499 N 200 W Unit 30
- 499 N 200 W Unit 19
- 1410 N 200 W
- 789 W 1950 N