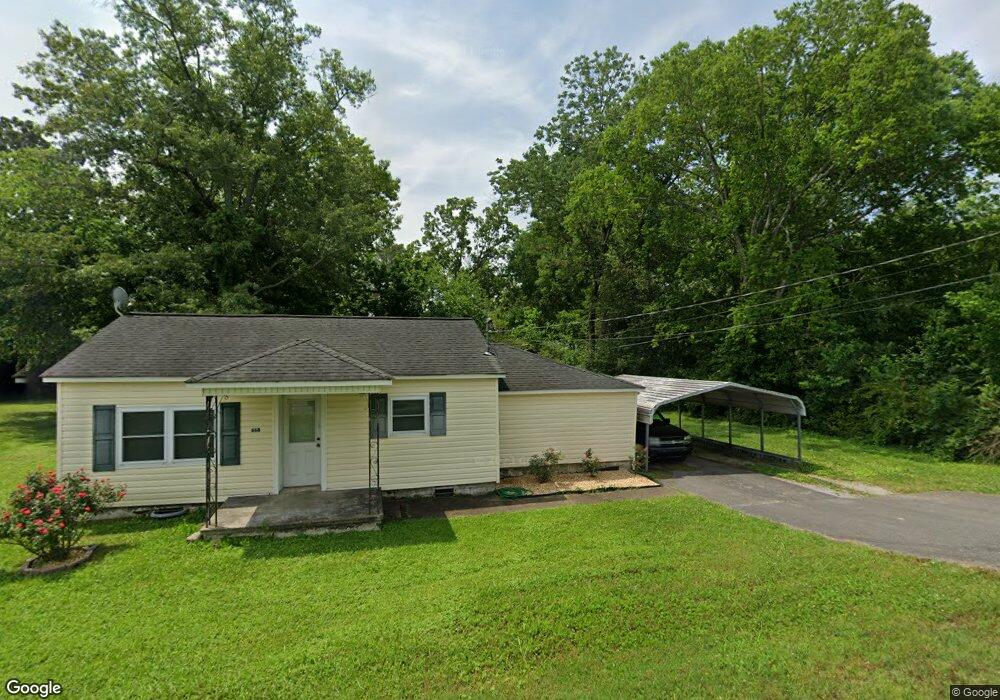
668 W State Line Rd Rossville, GA 30741
Lakeview NeighborhoodEstimated Value: $157,903 - $195,000
2
Beds
1
Bath
973
Sq Ft
$181/Sq Ft
Est. Value
About This Home
This home is located at 668 W State Line Rd, Rossville, GA 30741 and is currently estimated at $175,726, approximately $180 per square foot. 668 W State Line Rd is a home located in Catoosa County with nearby schools including West Side Elementary School, Lakeview Middle School, and Lakeview-Fort Oglethorpe High School.
Ownership History
Date
Name
Owned For
Owner Type
Purchase Details
Closed on
May 16, 2008
Sold by
Lasalle Bank National Asso
Bought by
Tapley Denford A
Current Estimated Value
Home Financials for this Owner
Home Financials are based on the most recent Mortgage that was taken out on this home.
Original Mortgage
$61,250
Outstanding Balance
$38,749
Interest Rate
5.86%
Mortgage Type
New Conventional
Estimated Equity
$136,977
Purchase Details
Closed on
Dec 5, 2007
Sold by
Vanarsdale Frederick C
Bought by
Lasalle Bank National Associat
Purchase Details
Closed on
Dec 20, 2006
Sold by
Land Colin
Bought by
Vanarsdale Fredrick C
Home Financials for this Owner
Home Financials are based on the most recent Mortgage that was taken out on this home.
Original Mortgage
$90,155
Interest Rate
6.1%
Mortgage Type
New Conventional
Purchase Details
Closed on
Jun 23, 2006
Sold by
Carter Robert
Bought by
Land Colin
Purchase Details
Closed on
Jul 15, 2005
Sold by
Not Provided
Bought by
Tapley Denford A
Create a Home Valuation Report for This Property
The Home Valuation Report is an in-depth analysis detailing your home's value as well as a comparison with similar homes in the area
Home Values in the Area
Average Home Value in this Area
Purchase History
| Date | Buyer | Sale Price | Title Company |
|---|---|---|---|
| Tapley Denford A | $63,145 | -- | |
| Lasalle Bank National Associat | -- | -- | |
| Vanarsdale Fredrick C | $94,900 | -- | |
| Land Colin | $90,000 | -- | |
| Tapley Denford A | -- | -- |
Source: Public Records
Mortgage History
| Date | Status | Borrower | Loan Amount |
|---|---|---|---|
| Open | Tapley Denford A | $61,250 | |
| Previous Owner | Vanarsdale Fredrick C | $90,155 |
Source: Public Records
Tax History Compared to Growth
Tax History
| Year | Tax Paid | Tax Assessment Tax Assessment Total Assessment is a certain percentage of the fair market value that is determined by local assessors to be the total taxable value of land and additions on the property. | Land | Improvement |
|---|---|---|---|---|
| 2024 | $898 | $42,092 | $8,996 | $33,096 |
| 2023 | $737 | $32,908 | $8,996 | $23,912 |
| 2022 | $596 | $26,636 | $8,996 | $17,640 |
| 2021 | $557 | $26,636 | $8,996 | $17,640 |
| 2020 | $531 | $22,938 | $8,225 | $14,713 |
| 2019 | $537 | $22,938 | $8,225 | $14,713 |
| 2018 | $503 | $20,345 | $5,632 | $14,713 |
| 2017 | $496 | $20,080 | $5,632 | $14,448 |
| 2016 | $493 | $18,966 | $5,632 | $13,334 |
| 2015 | -- | $18,966 | $5,632 | $13,334 |
| 2014 | -- | $18,966 | $5,632 | $13,334 |
| 2013 | -- | $18,966 | $5,632 | $13,334 |
Source: Public Records
Map
Nearby Homes
- 12 Osceola Ave
- 2105 McBrien Rd
- 19 Winchester Dr
- 2 Bell Ave
- 2009 McBrien Rd
- 372 Kelsey Dr
- 1906 McBrien Rd
- 4290 Spriggs St
- 66 Loach Dr
- 4011 Sherlin Dr
- 243 Greens Lake Cir
- 375 Greens Lake Cir
- 1149 Lakeview Dr
- 4016 Wonder Dr
- 4033 Wonder Dr
- 4921 Court Dr
- 3910 N Mission Oaks Dr
- 276 S Center St
- 214 Park St
- 232 Greenfield Dr
- 682 W State Line Rd
- 626 W State Line Rd
- 2195 Dugan Ave
- 694 Stateline Rd
- 694 W State Line Rd
- 31 Mineola Ave
- 41 Mineola Ave
- 15 Mineola Ave
- 2187 Dugan Ave
- 712-714 W State Line Rd
- 712 W State Line Rd
- 72 Osceola Ave
- 51 Mineola Ave
- 714 W State Line Rd
- 712 714 W State Line Rd
- 2180 Dugan Ave
- 63 Mineola Ave
- 2179 Dugan Ave
- 2182 Dugan St
- 726 W State Line Rd