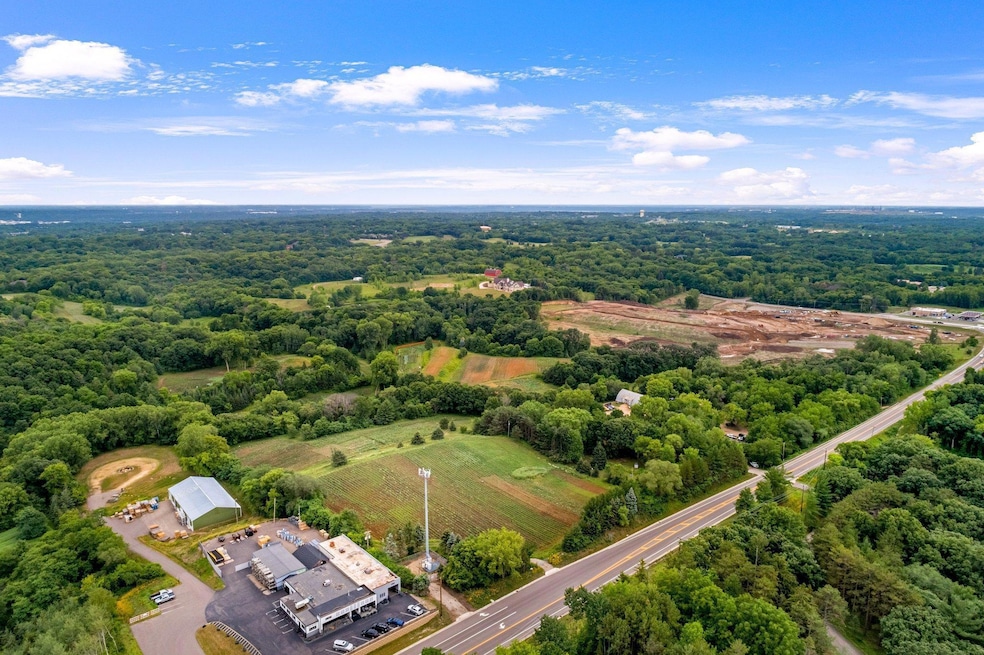
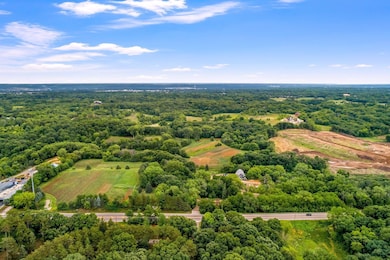
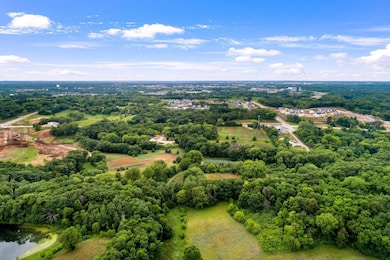
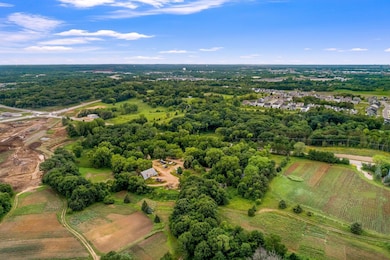
6680 S Robert Trail Inver Grove Heights, MN 55077
Estimated payment $16,092/month
About This Lot
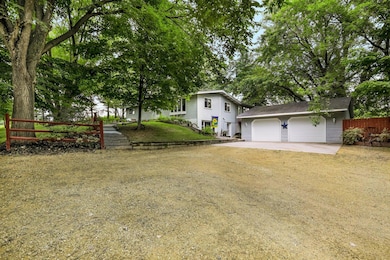
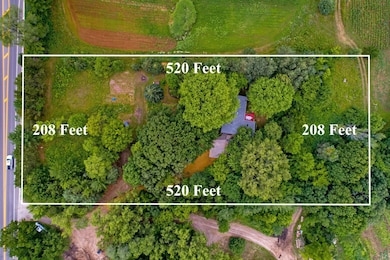
31.14 acres of prime residential development land. Additionally the adjacent 2.5 acre parcel located at 6570 South Robert Trail with a home on it is also available for an additional cost.
Property Details
Property Type
- Land
Est. Annual Taxes
- $12,488
Lot Details
- Lot Dimensions are 1120x1310x1120x1310
Community Details
- No Home Owners Association
Listing and Financial Details
- Assessor Parcel Number 200050051010
Map
Home Values in the Area
Average Home Value in this Area
Tax History
| Year | Tax Paid | Tax Assessment Tax Assessment Total Assessment is a certain percentage of the fair market value that is determined by local assessors to be the total taxable value of land and additions on the property. | Land | Improvement |
|---|---|---|---|---|
| 2024 | $12,108 | $1,929,100 | $1,910,900 | $18,200 |
| 2023 | $12,108 | $1,891,200 | $1,873,000 | $18,200 |
| 2022 | $7,842 | $1,716,200 | $1,698,000 | $18,200 |
| 2021 | $7,412 | $1,519,100 | $1,500,900 | $18,200 |
| 2020 | $7,072 | $1,441,100 | $1,422,900 | $18,200 |
| 2019 | $7,046 | $1,367,300 | $1,349,100 | $18,200 |
| 2018 | $6,038 | $1,298,500 | $1,280,300 | $18,200 |
| 2017 | $6,265 | $1,214,700 | $1,196,500 | $18,200 |
| 2016 | $5,641 | $1,140,000 | $1,121,800 | $18,200 |
| 2015 | $5,929 | $346,900 | $328,700 | $18,200 |
| 2014 | -- | $346,900 | $328,700 | $18,200 |
| 2013 | -- | $331,300 | $313,100 | $18,200 |
Property History
| Date | Event | Price | List to Sale | Price per Sq Ft |
|---|---|---|---|---|
| 04/24/2025 04/24/25 | For Sale | $2,850,000 | -- | -- |
Source: NorthstarMLS
MLS Number: 6710575
APN: 20-00500-51-010
Disclaimer: Certain information contained herein is derived from information provided by parties other than Homes.com. All information provided is deemed reliable, but is not guaranteed to be accurate and should be independently verified.
![]() Based on information submitted to the MLS GRID. All data is obtained from various sources and may not have been verified by broker or MLS GRID. Supplied Open House Information is subject to change without notice. All information should be independently reviewed and verified for accuracy. Properties may or may not be listed by the office/agent presenting the information. Some IDX listings have been excluded from this website.
Based on information submitted to the MLS GRID. All data is obtained from various sources and may not have been verified by broker or MLS GRID. Supplied Open House Information is subject to change without notice. All information should be independently reviewed and verified for accuracy. Properties may or may not be listed by the office/agent presenting the information. Some IDX listings have been excluded from this website.
The Digital Millennium Copyright Act of 1998, 17 U.S.C. § 512 (the “DMCA”) provides recourse for copyright owners who believe that material appearing on the Internet infringes their rights under U.S. copyright law. If you believe in good faith that any content or material made available in connection with our website or services infringes your copyright, you (or your agent) may send us a notice requesting that the content or material be removed, or access to it blocked.
Notices must be sent in writing by email to DMCAnotice@MLSGrid.com.
The DMCA requires that your notice of alleged copyright infringement include the following information:
(1) description of the copyrighted work that is the subject of claimed infringement;
(2) description of the alleged infringing content and information sufficient to permit us to locate the content;
(3) contact information for you, including your address, telephone number and email address;
(4) a statement by you that you have a good faith belief that the content in the manner complained of is not authorized by the copyright owner, or its agent, or by the operation of any law;
(5) a statement by you, signed under penalty of perjury, that the information in the notification is accurate and that you have the authority to enforce the copyrights that are claimed to be infringed; and
(6) a physical or electronic signature of the copyright owner or a person authorized to act on the copyright owner’s behalf. Failure to include all of the above information may result in the delay of the processing of your complaint.
- 7278 Ambercrest Curve
- 7310 Ambercrest Curve
- 7334 Ambercrest Curve
- The Newport Plan at Peltier Reserve - Peltier Reserve Inver Grove Heights
- The Oakmont Plan at Peltier Reserve - Peltier Reserve Inver Grove Heights
- The Royal Plan at Peltier Reserve - Peltier Reserve Inver Grove Heights
- The Augusta Plan at Peltier Reserve - Peltier Reserve Inver Grove Heights
- The Brookside Plan at Peltier Reserve - Peltier Reserve Inver Grove Heights
- The Kingsley Plan at Peltier Reserve - Peltier Reserve Inver Grove Heights
- The Monterey I Plan at Peltier Reserve - Peltier Reserve Inver Grove Heights
- The Olympia Plan at Peltier Reserve - Peltier Reserve Inver Grove Heights
- The Monterey III Plan at Peltier Reserve - Peltier Reserve Inver Grove Heights
- The Butler Plan at Peltier Reserve - Peltier Reserve Inver Grove Heights
- The Monterey II Plan at Peltier Reserve - Peltier Reserve Inver Grove Heights
- 7317 Agate Trail
- The Ridgewood Plan at Peltier Reserve - Peltier Reserve Inver Grove Heights
- 7329 Agate Trail
- Garrison Plan at Peltier Reserve
- Eastbrook Plan at Peltier Reserve
- The Highland Plan at Peltier Reserve
- 6848 Aqua Trail
- 6930 Angela Trail
- 6997 Angela Trail
- 6757 Allen Ct
- 1455 Upper 55th St E
- 1462 80th St E
- 5335-5365 Audobon Ave
- 1860 52nd St E
- 710 Vikings Pkwy
- 4930 Ashley Ln
- 3288 Dodd Ln
- 4835 Babcock Trail
- 5480 Blackberry Trail
- 5721-5733 Brent Ave
- 6043 Candace Ave
- 2060 Charlton St
- 2044 Oakdale Ave
- 8213 College Trail
- 430 Mendota Rd
- 4970 Boyd Ave
