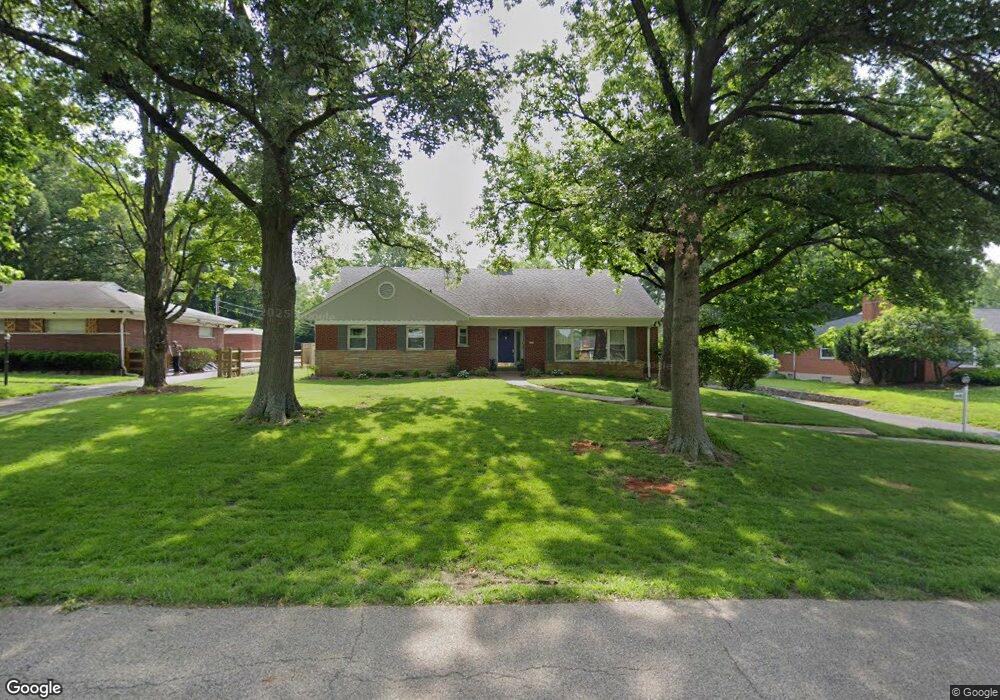
6680 W Farm Acres Dr Cincinnati, OH 45237
Estimated Value: $554,345 - $835,000
3
Beds
3
Baths
3,334
Sq Ft
$209/Sq Ft
Est. Value
About This Home
This home is located at 6680 W Farm Acres Dr, Cincinnati, OH 45237 and is currently estimated at $697,836, approximately $209 per square foot. 6680 W Farm Acres Dr is a home located in Hamilton County with nearby schools including Pleasant Ridge Montessori School, Shroder High School, and Clark Montessori High School.
Ownership History
Date
Name
Owned For
Owner Type
Purchase Details
Closed on
Apr 4, 2017
Sold by
Smith Elliot and Smith Tamar
Bought by
Rosen Robert and Rosen Cynthia
Current Estimated Value
Purchase Details
Closed on
May 11, 2004
Sold by
Thurman Milton and Thurman Sharon L
Bought by
Smith Elliot and Smith Tamar
Home Financials for this Owner
Home Financials are based on the most recent Mortgage that was taken out on this home.
Original Mortgage
$295,500
Interest Rate
5.85%
Mortgage Type
Unknown
Purchase Details
Closed on
Dec 17, 1997
Sold by
Thurman Milton
Bought by
Thurman Sharon L and Thurman Milton
Purchase Details
Closed on
Dec 16, 1994
Sold by
Thurman Deborah A
Bought by
Thurman Milton
Home Financials for this Owner
Home Financials are based on the most recent Mortgage that was taken out on this home.
Original Mortgage
$110,000
Interest Rate
9.24%
Create a Home Valuation Report for This Property
The Home Valuation Report is an in-depth analysis detailing your home's value as well as a comparison with similar homes in the area
Home Values in the Area
Average Home Value in this Area
Purchase History
| Date | Buyer | Sale Price | Title Company |
|---|---|---|---|
| Rosen Robert | $380,000 | -- | |
| Smith Elliot | -- | -- | |
| Thurman Sharon L | -- | -- | |
| Thurman Milton | -- | -- |
Source: Public Records
Mortgage History
| Date | Status | Borrower | Loan Amount |
|---|---|---|---|
| Previous Owner | Smith Elliot | $295,500 | |
| Previous Owner | Thurman Milton | $110,000 |
Source: Public Records
Tax History Compared to Growth
Tax History
| Year | Tax Paid | Tax Assessment Tax Assessment Total Assessment is a certain percentage of the fair market value that is determined by local assessors to be the total taxable value of land and additions on the property. | Land | Improvement |
|---|---|---|---|---|
| 2024 | $8,134 | $139,041 | $22,603 | $116,438 |
| 2023 | $8,316 | $139,041 | $22,603 | $116,438 |
| 2022 | $10,373 | $150,290 | $18,249 | $132,041 |
| 2021 | $10,103 | $150,290 | $18,249 | $132,041 |
| 2020 | $10,262 | $150,290 | $18,249 | $132,041 |
| 2019 | $10,014 | $133,000 | $16,149 | $116,851 |
| 2018 | $10,032 | $133,000 | $16,149 | $116,851 |
| 2017 | $9,579 | $133,000 | $16,149 | $116,851 |
| 2016 | $5,356 | $71,226 | $14,368 | $56,858 |
| 2015 | $4,858 | $71,226 | $14,368 | $56,858 |
| 2014 | $4,892 | $71,226 | $14,368 | $56,858 |
| 2013 | $5,283 | $75,772 | $15,285 | $60,487 |
Source: Public Records
Map
Nearby Homes
- 2365 Vera Ave
- 6770 Elbrook Ave
- 2537 Vera Ave
- 2524 Ardmore Ave
- 2539 Vera Ave
- 2541 Vera Ave
- 2543 Vera Ave
- 2652 Cedarbrook Dr
- 2425 Bremont Ave
- 2526 Bremont Ave
- 6322 Elbrook Ave
- 2424 Canterbury Ave
- 2604 Saint Albans Ave
- 2758 Losantiridge Ave
- 2783 Losantiridge Ave
- 6243 Graceland Ave
- 6235 Ridgeacres Dr
- 6230 Stover Ave
- 7110 Eastlawn Dr
- 7100 Eastlawn Dr
- 6660 W Farm Acres Dr
- 6700 W Farm Acres Dr
- 6710 W Farm Acres Dr
- 6640 W Farm Acres Dr
- 6693 E Farm Acres Dr
- 6713 E Farm Acres Dr
- 6673 E Farm Acres Dr
- 6695 W Farm Acres Dr
- 6685 W Farm Acres Dr
- 6715 W Farm Acres Dr
- 6723 E Farm Acres Dr
- 6665 W Farm Acres Dr
- 6720 W Farm Acres Dr
- 6653 E Farm Acres Dr
- 6725 W Farm Acres Dr
- 6733 E Farm Acres Dr
- 6645 W Farm Acres Dr
- 6740 W Farm Acres Dr
- 6625 W Farm Acres Dr
- 6745 W Farm Acres Dr