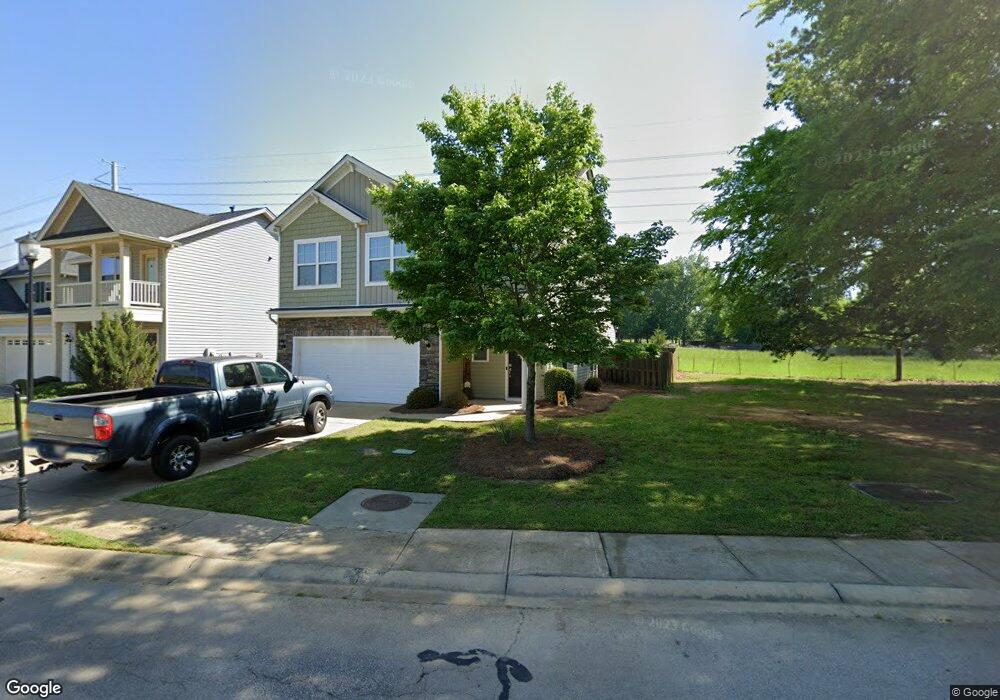
669 Clover View Rd Chapin, SC 29036
Estimated Value: $314,000 - $326,000
3
Beds
3
Baths
2,196
Sq Ft
$145/Sq Ft
Est. Value
About This Home
This home is located at 669 Clover View Rd, Chapin, SC 29036 and is currently estimated at $319,373, approximately $145 per square foot. 669 Clover View Rd is a home located in Richland County with nearby schools including Ballentine Elementary School, Chapin Intermediate, and Chapin High School.
Ownership History
Date
Name
Owned For
Owner Type
Purchase Details
Closed on
Apr 13, 2021
Sold by
Burns Christopher and Whitehead Jordan
Bought by
Egbert Christian
Current Estimated Value
Home Financials for this Owner
Home Financials are based on the most recent Mortgage that was taken out on this home.
Original Mortgage
$213,400
Outstanding Balance
$192,829
Interest Rate
3.05%
Mortgage Type
New Conventional
Estimated Equity
$126,544
Purchase Details
Closed on
Sep 22, 2017
Sold by
Livingston Jason M
Bought by
Burns Christopher and Whitehead Jordan
Home Financials for this Owner
Home Financials are based on the most recent Mortgage that was taken out on this home.
Original Mortgage
$185,400
Interest Rate
3.9%
Mortgage Type
New Conventional
Purchase Details
Closed on
Feb 17, 2012
Sold by
Mungo Homes Inc
Bought by
Livingston Jason M
Home Financials for this Owner
Home Financials are based on the most recent Mortgage that was taken out on this home.
Original Mortgage
$149,552
Interest Rate
3.92%
Mortgage Type
New Conventional
Create a Home Valuation Report for This Property
The Home Valuation Report is an in-depth analysis detailing your home's value as well as a comparison with similar homes in the area
Home Values in the Area
Average Home Value in this Area
Purchase History
| Date | Buyer | Sale Price | Title Company |
|---|---|---|---|
| Egbert Christian | $220,000 | None Available | |
| Egbert Christian | $220,000 | None Listed On Document | |
| Burns Christopher | $206,000 | None Available | |
| Livingston Jason M | $149,552 | -- |
Source: Public Records
Mortgage History
| Date | Status | Borrower | Loan Amount |
|---|---|---|---|
| Open | Egbert Christian | $213,400 | |
| Closed | Egbert Christian | $213,400 | |
| Previous Owner | Burns Christopher | $185,400 | |
| Previous Owner | Livingston Jason M | $149,552 |
Source: Public Records
Tax History
| Year | Tax Paid | Tax Assessment Tax Assessment Total Assessment is a certain percentage of the fair market value that is determined by local assessors to be the total taxable value of land and additions on the property. | Land | Improvement |
|---|---|---|---|---|
| 2024 | $2,213 | $253,000 | $0 | $0 |
| 2023 | $2,127 | $8,800 | $0 | $0 |
| 2022 | $1,846 | $220,000 | $33,200 | $186,800 |
| 2021 | $1,764 | $8,240 | $0 | $0 |
| 2020 | $1,844 | $8,240 | $0 | $0 |
| 2019 | $1,826 | $8,240 | $0 | $0 |
| 2018 | $1,620 | $8,240 | $0 | $0 |
| 2017 | $1,213 | $5,980 | $0 | $0 |
| 2016 | $1,208 | $5,980 | $0 | $0 |
| 2015 | $1,214 | $5,980 | $0 | $0 |
| 2014 | $1,211 | $149,600 | $0 | $0 |
| 2013 | -- | $5,980 | $0 | $0 |
Source: Public Records
Map
Nearby Homes
- 426 Crawley Ln
- 445 Crawley Ln
- 804 Burnview Ln
- 761 Kimsey Dr
- 549 Everton Dr
- 320 Hollow Cove Rd
- 297 Massey Cir
- 301 Massey Cir
- 11437 Broad River
- 101 Summer Branch Ln
- 1160 Bookie Richardson Rd
- 203 Savannah Branch Trail
- 116 Savannah Branch Trail
- 325 Nichols Branch Ln
- 1109 Hopewell Church Rd
- 342 Meadow Ridge Rd
- 404 Crims Creek Way
- 50 Steve Free Rd
- 145 Monroe Preserve Ln
- 105 Monroe Preserve Ln
- 665 Clover View Rd
- 661 Clover View Rd
- 657 Clover View Rd
- 653 Clover View Rd
- 409 Crawley Ln
- 656 Clover View Rd
- 413 Crawley Ln
- 652 Clover View Rd
- 132 Westcott Ridge Rd
- 645 Clover View Rd
- 128 Westcott Ridge Rd
- 417 Crawley Ln
- 648 Clover View Rd
- 641 Clover View Rd
- 421 Crawley Ln
- 644 Clover View Rd
- 637 Clover View Rd
- 640 Clover View Rd
- 845 Burnview Ln
- 845 Burnview Ln
Your Personal Tour Guide
Ask me questions while you tour the home.