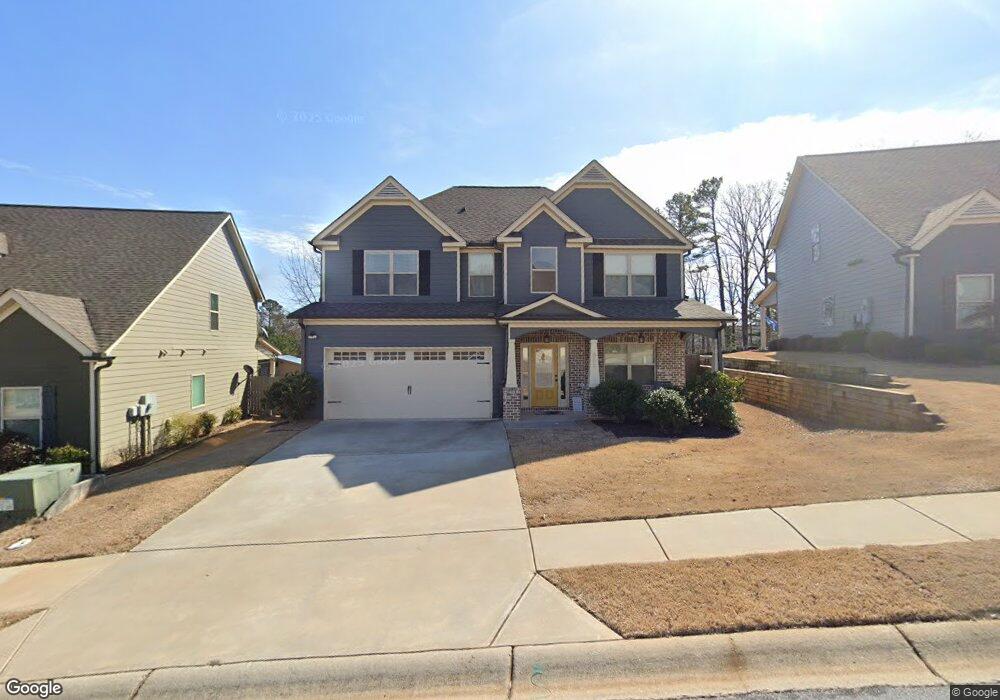
669 Holliman Cir Unit 35 Pendergrass, GA 30567
Estimated Value: $349,000 - $390,000
--
Bed
1
Bath
2,141
Sq Ft
$175/Sq Ft
Est. Value
About This Home
This home is located at 669 Holliman Cir Unit 35, Pendergrass, GA 30567 and is currently estimated at $375,334, approximately $175 per square foot. 669 Holliman Cir Unit 35 is a home located in Jackson County with nearby schools including North Jackson Elementary School, West Jackson Middle School, and Jackson County High School.
Ownership History
Date
Name
Owned For
Owner Type
Purchase Details
Closed on
Mar 2, 2023
Sold by
Newsom Joshua Alan
Bought by
Permaul Jason and Permaul Randy
Current Estimated Value
Home Financials for this Owner
Home Financials are based on the most recent Mortgage that was taken out on this home.
Original Mortgage
$292,800
Outstanding Balance
$283,541
Interest Rate
6.09%
Mortgage Type
New Conventional
Estimated Equity
$91,793
Purchase Details
Closed on
Nov 10, 2022
Sold by
Bachota Steven M
Bought by
Newsom Joshua Alan and Newsom Angelica
Purchase Details
Closed on
Jul 27, 2018
Sold by
Lumpkin Street Holdings Llc
Bought by
Bachota Steven M and Yarbrough Samantha
Purchase Details
Closed on
Oct 15, 2014
Sold by
G T Property Development Llc
Bought by
Lumpkin Street Holdings Llc
Purchase Details
Closed on
Feb 22, 2005
Sold by
Tolbert Glenda
Bought by
G T Property Development Llc
Purchase Details
Closed on
Aug 3, 2001
Sold by
Estate Of Glenn Gee
Bought by
Tolbert Glenda G
Create a Home Valuation Report for This Property
The Home Valuation Report is an in-depth analysis detailing your home's value as well as a comparison with similar homes in the area
Home Values in the Area
Average Home Value in this Area
Purchase History
| Date | Buyer | Sale Price | Title Company |
|---|---|---|---|
| Permaul Jason | $366,000 | -- | |
| Newsom Joshua Alan | $356,000 | -- | |
| Bachota Steven M | $222,900 | -- | |
| Lumpkin Street Holdings Llc | $20,000 | -- | |
| G T Property Development Llc | -- | -- | |
| Tolbert Glenda G | -- | -- |
Source: Public Records
Mortgage History
| Date | Status | Borrower | Loan Amount |
|---|---|---|---|
| Open | Permaul Jason | $292,800 |
Source: Public Records
Tax History Compared to Growth
Tax History
| Year | Tax Paid | Tax Assessment Tax Assessment Total Assessment is a certain percentage of the fair market value that is determined by local assessors to be the total taxable value of land and additions on the property. | Land | Improvement |
|---|---|---|---|---|
| 2024 | $4,524 | $151,440 | $24,600 | $126,840 |
| 2023 | $4,413 | $137,280 | $24,600 | $112,680 |
| 2022 | $3,574 | $113,120 | $24,600 | $88,520 |
| 2021 | $3,327 | $104,520 | $16,000 | $88,520 |
| 2020 | $3,257 | $94,280 | $16,000 | $78,280 |
| 2019 | $3,198 | $89,280 | $8,000 | $81,280 |
| 2018 | $290 | $8,000 | $8,000 | $0 |
| 2017 | $292 | $8,000 | $8,000 | $0 |
| 2016 | $293 | $8,000 | $8,000 | $0 |
| 2015 | $295 | $8,000 | $8,000 | $0 |
| 2014 | $111 | $3,000 | $3,000 | $0 |
| 2013 | -- | $3,000 | $3,000 | $0 |
Source: Public Records
Map
Nearby Homes
- 180 Brooks Village Dr
- 72 Hidden Pines Cir
- 575 Cottage Loop
- 343 Merigold Way
- 331 Merigold Way
- 410 Winter Chase
- 306 Seasons Valley
- 1039 Sope Creek Cir
- 1042 Sope Creek Cir
- 1308 Turning Leaf Ln
- 1063 Sope Creek Cir
- 337 Darling Ln
- 334 Glenn Abby Ln
- 1028 Sope Creek Cir
- 1075 Sope Creek Cir
- 954 Sope Creek Cir
- 186 Wynn Way
- 152 Mountain Creek Dr
- 65 Academy St
- 169 Wynn Way
- 669 Holliman Cir
- 828 Holliman Cir Unit 35
- 828 Holliman Cir
- 828 Marlow Cir
- 629 Holliman Cir Unit 36
- 629 Holliman Cir
- 818 Holliman Cir Unit 34
- 818 Holliman Cir
- 648 Holliman Cir Unit 17
- 648 Holliman Cir
- 678 Holliman Cir
- 668 Holliman Cir Unit 19
- 668 Holliman Cir
- 658 Holliman Cir Unit 18
- 658 Holliman Cir
- 678 Holliman Cir Unit 20
- 678 Holliman Cir
- 638 Holliman Cir Unit 16
- 638 Holliman Cir
- 609 Holliman Cir Unit 37