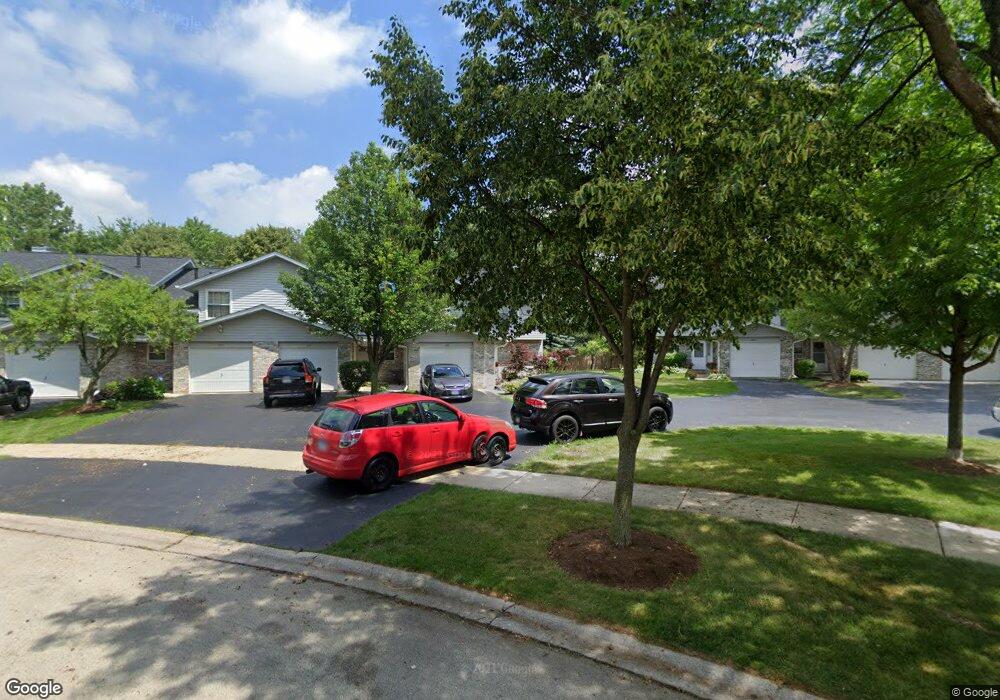
669 N Tamarac Blvd Unit 1 Addison, IL 60101
Estimated Value: $305,000 - $324,292
2
Beds
3
Baths
1,636
Sq Ft
$194/Sq Ft
Est. Value
About This Home
This home is located at 669 N Tamarac Blvd Unit 1, Addison, IL 60101 and is currently estimated at $316,573, approximately $193 per square foot. 669 N Tamarac Blvd Unit 1 is a home located in DuPage County with nearby schools including Marquardt Middle School, Glenbard East High School, and St Philip The Apostle School.
Ownership History
Date
Name
Owned For
Owner Type
Purchase Details
Closed on
Jun 1, 1999
Sold by
Beach Ronald S and Ochoa Beach Marisa
Bought by
Engel Richard W and Engel Lauren M
Current Estimated Value
Home Financials for this Owner
Home Financials are based on the most recent Mortgage that was taken out on this home.
Original Mortgage
$139,200
Outstanding Balance
$36,530
Interest Rate
6.99%
Mortgage Type
VA
Estimated Equity
$280,043
Purchase Details
Closed on
Jul 10, 1995
Sold by
Scott Fleming and Scott Sharon
Bought by
Beach Ronald S and Ochoa Beach Marisa
Home Financials for this Owner
Home Financials are based on the most recent Mortgage that was taken out on this home.
Original Mortgage
$113,548
Interest Rate
7.61%
Mortgage Type
FHA
Create a Home Valuation Report for This Property
The Home Valuation Report is an in-depth analysis detailing your home's value as well as a comparison with similar homes in the area
Home Values in the Area
Average Home Value in this Area
Purchase History
| Date | Buyer | Sale Price | Title Company |
|---|---|---|---|
| Engel Richard W | $136,500 | -- | |
| Beach Ronald S | $114,500 | 1St American Title |
Source: Public Records
Mortgage History
| Date | Status | Borrower | Loan Amount |
|---|---|---|---|
| Open | Engel Richard W | $139,200 | |
| Previous Owner | Beach Ronald S | $113,548 |
Source: Public Records
Tax History Compared to Growth
Tax History
| Year | Tax Paid | Tax Assessment Tax Assessment Total Assessment is a certain percentage of the fair market value that is determined by local assessors to be the total taxable value of land and additions on the property. | Land | Improvement |
|---|---|---|---|---|
| 2024 | -- | $87,830 | $13,964 | $73,866 |
| 2023 | -- | $80,320 | $12,770 | $67,550 |
| 2022 | $0 | $69,570 | $9,000 | $60,570 |
| 2021 | $2,738 | $66,100 | $8,550 | $57,550 |
| 2020 | $0 | $65,090 | $8,340 | $56,750 |
| 2019 | $2,738 | $62,550 | $8,010 | $54,540 |
| 2018 | $0 | $49,810 | $6,380 | $43,430 |
| 2017 | $2,723 | $46,160 | $5,910 | $40,250 |
| 2016 | $2,723 | $42,720 | $5,470 | $37,250 |
| 2015 | $2,723 | $39,860 | $5,100 | $34,760 |
| 2014 | $2,723 | $37,100 | $4,750 | $32,350 |
| 2013 | $4,057 | $38,370 | $4,910 | $33,460 |
Source: Public Records
Map
Nearby Homes
- 823 N Harrow Ct
- 818 N Rumple Ln
- 941 N Swift Rd Unit 301
- 881 N Swift Rd Unit 206
- 953 N Rohlwing Rd Unit GB
- 1750 W Woodland Ave
- 943 N Rohlwing Rd Unit 101H
- 1527 W Holtz Ave
- 22W070 Byron Ave
- 20W561 Army Trail Blvd
- 1660 W Prescott Place
- 5N260 Eagle Terrace
- 580 N Highlander Way
- 5N210 Central Rd
- 1210 N Foxdale Dr Unit 109
- 367 Golfview Ct
- 323 Morningside Dr Unit B
- 316 Morningside Dr Unit A
- 2 Willow Bridge Way
- 1275 W Lake St Unit 104
- 671 N Tamarac Blvd Unit O2
- 675 N Tamarac Blvd
- 673 N Tamarac Blvd Unit O3
- 665 N Tamarac Blvd Unit P3
- 663 N Tamarac Blvd Unit P2
- 661 N Tamarac Blvd Unit P1
- 657 N Tamarac Blvd Unit Q3
- 677 N Tamarac Blvd Unit N1
- 659 N Tamarac Blvd Unit Q4
- 655 N Tamarac Blvd Unit Q2
- 656 N Tamarac Blvd Unit EE1N
- 653 N Tamarac Blvd Unit 1
- 679 N Tamarac Blvd Unit N2
- 654 N Tamarac Blvd Unit 2
- 681 N Tamarac Blvd Unit 3
- 652 N Tamarac Blvd Unit EE3
- 651 N Tamarac Blvd
- 674 N Tamarac Blvd Unit DD1
- 683 N Tamarac Blvd
- 683 N Tamarac Blvd Unit 683