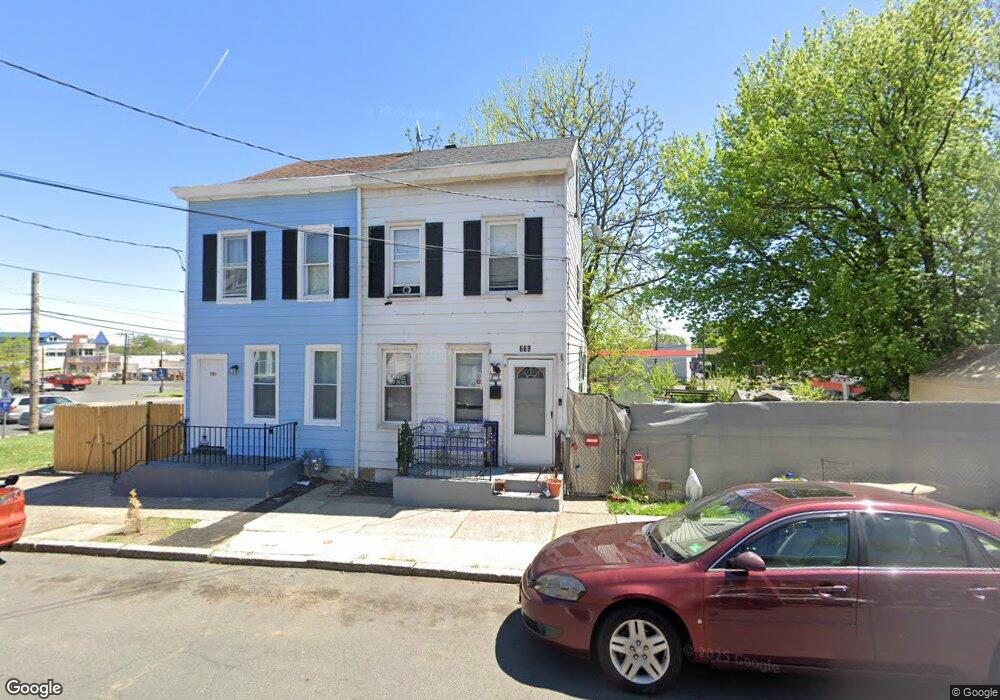
669 Pennsylvania Ave Trenton, NJ 08638
North Trenton NeighborhoodEstimated Value: $142,299 - $169,000
--
Bed
--
Bath
938
Sq Ft
$168/Sq Ft
Est. Value
About This Home
This home is located at 669 Pennsylvania Ave, Trenton, NJ 08638 and is currently estimated at $157,325, approximately $167 per square foot. 669 Pennsylvania Ave is a home located in Mercer County with nearby schools including Dr. Crosby Copeland Elementary School, Dr. Martin Luther King Middle School, and Trenton Central High School - Main Campus.
Ownership History
Date
Name
Owned For
Owner Type
Purchase Details
Closed on
Oct 22, 2018
Sold by
Patel Naresh R
Bought by
Mnp Mannat Company Llc
Current Estimated Value
Purchase Details
Closed on
Feb 20, 2006
Sold by
Grabowy Alina Fraczek
Bought by
Patel Naresh
Purchase Details
Closed on
Jul 15, 2003
Sold by
Dibenedetto Daniel
Bought by
Grabony Alina Fraczek
Home Financials for this Owner
Home Financials are based on the most recent Mortgage that was taken out on this home.
Original Mortgage
$85,500
Interest Rate
5.69%
Purchase Details
Closed on
Sep 28, 2001
Sold by
Dibenedetto Joan
Bought by
Dibenedetto Daniel
Home Financials for this Owner
Home Financials are based on the most recent Mortgage that was taken out on this home.
Original Mortgage
$54,150
Interest Rate
6.89%
Mortgage Type
FHA
Purchase Details
Closed on
Aug 25, 1994
Sold by
Dibenedetto Jennie
Bought by
Dibenedetto Joan
Create a Home Valuation Report for This Property
The Home Valuation Report is an in-depth analysis detailing your home's value as well as a comparison with similar homes in the area
Home Values in the Area
Average Home Value in this Area
Purchase History
| Date | Buyer | Sale Price | Title Company |
|---|---|---|---|
| Mnp Mannat Company Llc | -- | None Available | |
| Patel Naresh | $130,000 | -- | |
| Grabony Alina Fraczek | $95,000 | -- | |
| Dibenedetto Daniel | $55,000 | -- | |
| Dibenedetto Joan | $80,000 | -- |
Source: Public Records
Mortgage History
| Date | Status | Borrower | Loan Amount |
|---|---|---|---|
| Previous Owner | Grabony Alina Fraczek | $85,500 | |
| Previous Owner | Dibenedetto Daniel | $54,150 |
Source: Public Records
Tax History Compared to Growth
Tax History
| Year | Tax Paid | Tax Assessment Tax Assessment Total Assessment is a certain percentage of the fair market value that is determined by local assessors to be the total taxable value of land and additions on the property. | Land | Improvement |
|---|---|---|---|---|
| 2025 | $2,106 | $36,300 | $9,400 | $26,900 |
| 2024 | $2,021 | $36,300 | $9,400 | $26,900 |
| 2023 | $2,021 | $36,300 | $9,400 | $26,900 |
| 2022 | $1,981 | $36,300 | $9,400 | $26,900 |
| 2021 | $2,016 | $36,300 | $9,400 | $26,900 |
| 2020 | $2,009 | $36,300 | $9,400 | $26,900 |
| 2019 | $1,977 | $36,300 | $9,400 | $26,900 |
| 2018 | $1,892 | $36,300 | $9,400 | $26,900 |
| 2017 | $2,423 | $48,900 | $9,400 | $39,500 |
| 2016 | $2,928 | $50,900 | $28,400 | $22,500 |
| 2015 | $2,918 | $50,900 | $28,400 | $22,500 |
| 2014 | $2,904 | $50,900 | $28,400 | $22,500 |
Source: Public Records
Map
Nearby Homes
- 840 Pennsylvania Ave
- 813 Spruce St
- 920 Brunswick Ave
- 902 Ohio Ave
- 613 N Olden Ave
- 23 Cain Ave
- 101 Sherman Ave
- 103 Sherman Ave
- 1314 Princeton Ave
- 709 Mulberry St
- 1415 Princeton Ave
- 1134 Brunswick Ave
- 21 Stout Ave
- 18 Meade St
- 359 Saint Joes Ave
- 816 Mulberry St
- 94 100 E Paul Ave
- 68 Myrtle Ave
- 83 E Paul Ave
- 30 Mechanics Ave
- 671 Pennsylvania Ave
- 653 Pennsylvania Ave Unit 657
- 666 Pennsylvania Ave
- 662 Pennsylvania Ave
- 664 Pennsylvania Ave
- 647 Pennsylvania Ave
- 660 Pennsylvania Ave
- 658 Pennsylvania Ave
- 656 Pennsylvania Ave
- 645 Pennsylvania Ave
- 643 Pennsylvania Ave
- 923 N Olden Ave
- 638 Pennsylvania Ave
- 605 Pennsylvania Ave
- 636 Pennsylvania Ave
- 660 Ohio Ave
- 658 Ohio Ave
- 656 Ohio Ave
- 654 Ohio Ave
- 652 Ohio Ave