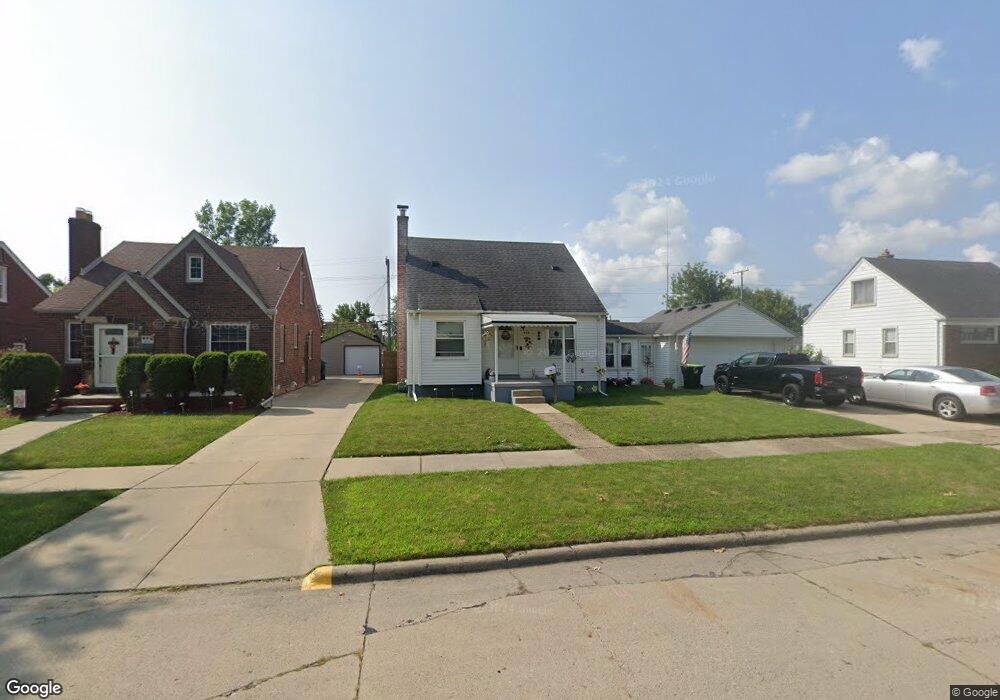
669 Riverbank St Lincoln Park, MI 48146
Estimated Value: $173,000 - $184,000
3
Beds
1
Bath
1,085
Sq Ft
$164/Sq Ft
Est. Value
About This Home
This home is located at 669 Riverbank St, Lincoln Park, MI 48146 and is currently estimated at $177,672, approximately $163 per square foot. 669 Riverbank St is a home located in Wayne County with nearby schools including Earl F. Carr School, Lincoln Park Middle School, and Lincoln Park High School.
Ownership History
Date
Name
Owned For
Owner Type
Purchase Details
Closed on
Aug 12, 2019
Sold by
Dancer Kimberly
Bought by
Rushlow Bruce J and Lemay Betty
Current Estimated Value
Home Financials for this Owner
Home Financials are based on the most recent Mortgage that was taken out on this home.
Original Mortgage
$99,170
Outstanding Balance
$78,200
Interest Rate
4.75%
Mortgage Type
FHA
Estimated Equity
$99,472
Purchase Details
Closed on
Jul 13, 2006
Sold by
Dancer Properties Llc
Bought by
Dancer Kimberly
Home Financials for this Owner
Home Financials are based on the most recent Mortgage that was taken out on this home.
Original Mortgage
$99,200
Interest Rate
7.87%
Mortgage Type
Purchase Money Mortgage
Purchase Details
Closed on
Jan 10, 2005
Sold by
Dancer Kimberly C
Bought by
Dancer Properties Llc
Create a Home Valuation Report for This Property
The Home Valuation Report is an in-depth analysis detailing your home's value as well as a comparison with similar homes in the area
Home Values in the Area
Average Home Value in this Area
Purchase History
| Date | Buyer | Sale Price | Title Company |
|---|---|---|---|
| Rushlow Bruce J | $101,000 | Premier Title Agency Llc | |
| Dancer Kimberly | -- | First American Title | |
| Dancer Properties Llc | -- | First American Title |
Source: Public Records
Mortgage History
| Date | Status | Borrower | Loan Amount |
|---|---|---|---|
| Open | Rushlow Bruce J | $99,170 | |
| Previous Owner | Dancer Kimberly | $99,200 |
Source: Public Records
Tax History Compared to Growth
Tax History
| Year | Tax Paid | Tax Assessment Tax Assessment Total Assessment is a certain percentage of the fair market value that is determined by local assessors to be the total taxable value of land and additions on the property. | Land | Improvement |
|---|---|---|---|---|
| 2025 | $1,608 | $91,300 | $0 | $0 |
| 2024 | $1,608 | $80,600 | $0 | $0 |
| 2023 | $1,524 | $73,700 | $0 | $0 |
| 2022 | $1,801 | $65,400 | $0 | $0 |
| 2021 | $1,761 | $61,600 | $0 | $0 |
| 2020 | $2,932 | $51,500 | $0 | $0 |
| 2019 | $1,381 | $45,100 | $0 | $0 |
| 2018 | $1,244 | $38,300 | $0 | $0 |
| 2017 | $908 | $33,700 | $0 | $0 |
| 2016 | $1,607 | $30,600 | $0 | $0 |
| 2015 | $2,970 | $29,700 | $0 | $0 |
| 2013 | $3,080 | $32,000 | $0 | $0 |
| 2012 | $2,226 | $33,100 | $9,900 | $23,200 |
Source: Public Records
Map
Nearby Homes
- 653 Leblanc St
- 573 Leblanc St
- 808 Kings Hwy
- 879 Highland Ave
- 788 Ford Blvd
- 707 Ford Blvd
- 893 Leblanc St
- 489 River Ct
- 932 River Ct
- 912 River Ct
- 944 Ford Blvd
- 520 New York Ave
- 300 Riverside Dr
- 963 Winchester Ave
- 1018 Riverbank St
- 301 Riverside Dr
- 973 Ford Blvd
- 734 Highland St
- 936 Cloverlawn Blvd
- 524 Pagel Ave
- 679 Riverbank St
- 703 Riverbank St
- 663 Riverbank St
- 657 Riverbank St
- 707 Riverbank St
- 674 Moran Ave
- 680 Moran Ave
- 670 Moran Ave
- 704 Moran Ave
- 713 Riverbank St
- 653 Riverbank St
- 674 Riverbank St
- 708 Moran Ave
- 670 Riverbank St
- 658 Moran Ave
- 680 Riverbank St
- 664 Riverbank St
- 704 Riverbank St
- 719 Riverbank St
- 629 Riverbank St