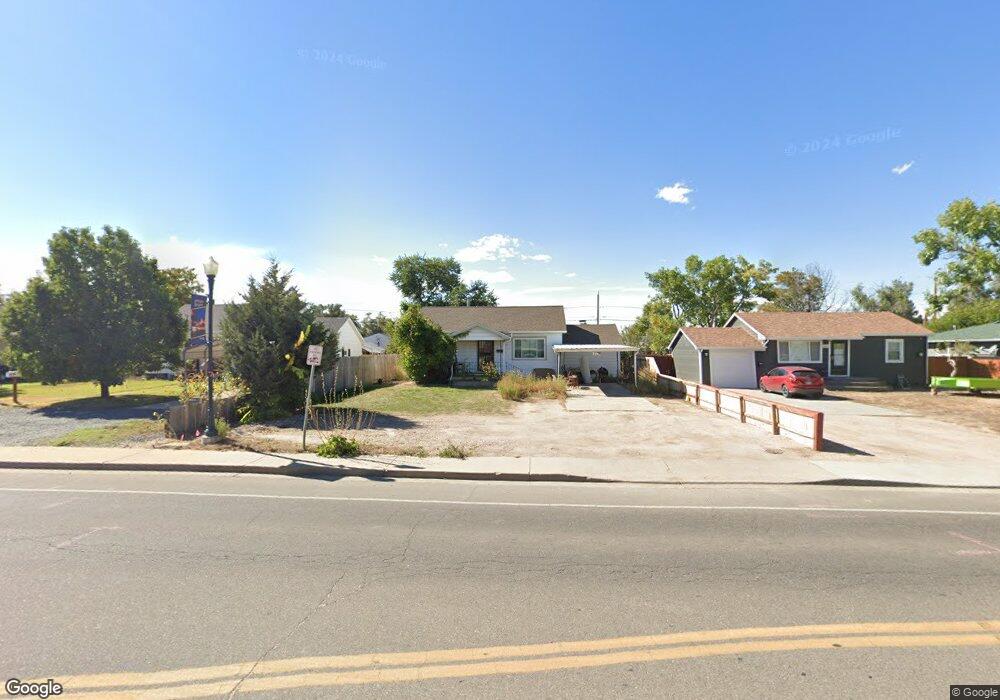
669 S 4th Ave Brighton, CO 80601
Estimated Value: $386,000 - $480,000
3
Beds
2
Baths
1,344
Sq Ft
$307/Sq Ft
Est. Value
About This Home
This home is located at 669 S 4th Ave, Brighton, CO 80601 and is currently estimated at $412,759, approximately $307 per square foot. 669 S 4th Ave is a home located in Adams County with nearby schools including South Elementary School, Vikan Middle School, and Brighton High School.
Ownership History
Date
Name
Owned For
Owner Type
Purchase Details
Closed on
Oct 29, 2007
Sold by
Fannie Mae
Bought by
Garcia Rafael Lopez
Current Estimated Value
Home Financials for this Owner
Home Financials are based on the most recent Mortgage that was taken out on this home.
Original Mortgage
$133,878
Outstanding Balance
$82,888
Interest Rate
6.32%
Mortgage Type
FHA
Estimated Equity
$329,871
Purchase Details
Closed on
Aug 14, 2007
Sold by
Wagner Donna K
Bought by
Federal National Mortgage Association
Purchase Details
Closed on
Jan 16, 1998
Sold by
Lee Sylvia M Trustee
Bought by
Wagner Donna K and Delventhal Verna M
Home Financials for this Owner
Home Financials are based on the most recent Mortgage that was taken out on this home.
Original Mortgage
$98,301
Interest Rate
7.16%
Create a Home Valuation Report for This Property
The Home Valuation Report is an in-depth analysis detailing your home's value as well as a comparison with similar homes in the area
Home Values in the Area
Average Home Value in this Area
Purchase History
| Date | Buyer | Sale Price | Title Company |
|---|---|---|---|
| Garcia Rafael Lopez | $136,000 | Security Title | |
| Federal National Mortgage Association | -- | None Available | |
| Wagner Donna K | $103,475 | -- |
Source: Public Records
Mortgage History
| Date | Status | Borrower | Loan Amount |
|---|---|---|---|
| Open | Garcia Rafael Lopez | $133,878 | |
| Previous Owner | Wagner Donna K | $98,301 |
Source: Public Records
Tax History
| Year | Tax Paid | Tax Assessment Tax Assessment Total Assessment is a certain percentage of the fair market value that is determined by local assessors to be the total taxable value of land and additions on the property. | Land | Improvement |
|---|---|---|---|---|
| 2025 | $2,207 | $29,440 | $6,120 | $23,320 |
| 2024 | $2,207 | $27,070 | $5,630 | $21,440 |
| 2023 | $2,197 | $30,440 | $6,090 | $24,350 |
| 2022 | $1,671 | $22,160 | $5,280 | $16,880 |
| 2021 | $2,282 | $22,160 | $5,280 | $16,880 |
| 2020 | $2,031 | $20,570 | $4,720 | $15,850 |
| 2019 | $2,033 | $20,570 | $4,720 | $15,850 |
| 2018 | $1,564 | $15,820 | $5,400 | $10,420 |
| 2017 | $1,562 | $15,820 | $5,400 | $10,420 |
| 2016 | $1,514 | $15,280 | $2,630 | $12,650 |
| 2015 | $1,511 | $15,280 | $2,630 | $12,650 |
| 2014 | -- | $12,830 | $2,070 | $10,760 |
Source: Public Records
Map
Nearby Homes
- 617 S 5th Ave
- 660 S 5th Ave
- 544 S 3rd Ave
- 765 S 1st Ave
- 475 S 2nd Ave
- 475 S 2nd Ave Unit Plot 1
- 141 E Bromley Ln
- 734 S 8th Ave
- 865 S 8th Ave
- 360 S 7th Ave
- 303 S 2nd Ave
- 219 S 3rd Ave
- 204 E Egbert St
- 792 S 12th Ave
- 135 S 3rd Ave
- 113 S 4th Ave
- 230 Ash Ave Unit 4
- 999 Skeel St
- 107 S 4th Ave
- 362 Dogwood Ave
Your Personal Tour Guide
Ask me questions while you tour the home.