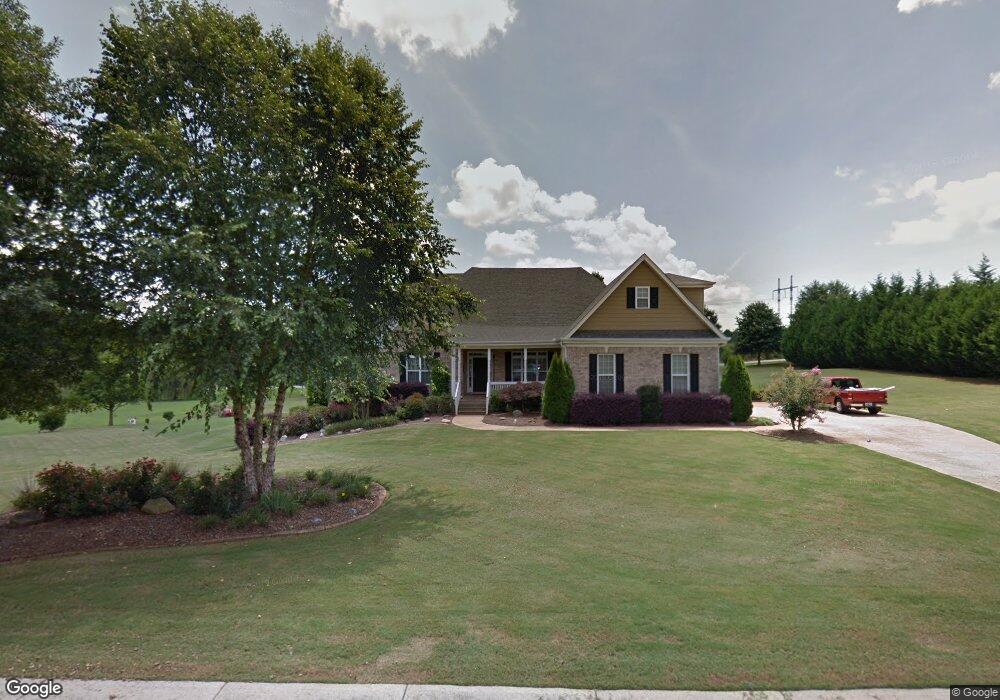
669 Washington Pkwy Jefferson, GA 30549
Estimated Value: $490,940 - $549,000
--
Bed
3
Baths
2,702
Sq Ft
$194/Sq Ft
Est. Value
About This Home
This home is located at 669 Washington Pkwy, Jefferson, GA 30549 and is currently estimated at $524,735, approximately $194 per square foot. 669 Washington Pkwy is a home located in Jackson County with nearby schools including Jefferson Elementary School, Jefferson Academy, and Jefferson Middle School.
Ownership History
Date
Name
Owned For
Owner Type
Purchase Details
Closed on
Oct 21, 2019
Sold by
Curry Dennis M
Bought by
Crosby Misty and Crosby Zachary
Current Estimated Value
Home Financials for this Owner
Home Financials are based on the most recent Mortgage that was taken out on this home.
Original Mortgage
$279,900
Outstanding Balance
$246,201
Interest Rate
3.7%
Estimated Equity
$278,534
Purchase Details
Closed on
Jul 7, 2008
Sold by
Curry Shari N
Bought by
Curry Dennis M
Purchase Details
Closed on
Mar 25, 2005
Sold by
Greenwood Builder Grp Inc
Bought by
Curry Dennis M and Curry Shari N
Home Financials for this Owner
Home Financials are based on the most recent Mortgage that was taken out on this home.
Original Mortgage
$187,900
Interest Rate
5.62%
Mortgage Type
New Conventional
Purchase Details
Closed on
Jul 12, 2004
Sold by
Beatty Properties In
Bought by
Greenwood Builder Group Inc
Purchase Details
Closed on
Jan 21, 2000
Sold by
Beatty Michael
Bought by
Beatty Properties In
Create a Home Valuation Report for This Property
The Home Valuation Report is an in-depth analysis detailing your home's value as well as a comparison with similar homes in the area
Home Values in the Area
Average Home Value in this Area
Purchase History
| Date | Buyer | Sale Price | Title Company |
|---|---|---|---|
| Crosby Misty | $315,000 | -- | |
| Curry Dennis M | -- | -- | |
| Curry Dennis M | $234,900 | -- | |
| Greenwood Builder Group Inc | $175,000 | -- | |
| Beatty Properties In | -- | -- |
Source: Public Records
Mortgage History
| Date | Status | Borrower | Loan Amount |
|---|---|---|---|
| Open | Crosby Misty | $279,900 | |
| Previous Owner | Curry Dennis M | $187,900 |
Source: Public Records
Tax History Compared to Growth
Tax History
| Year | Tax Paid | Tax Assessment Tax Assessment Total Assessment is a certain percentage of the fair market value that is determined by local assessors to be the total taxable value of land and additions on the property. | Land | Improvement |
|---|---|---|---|---|
| 2024 | $5,068 | $184,640 | $20,800 | $163,840 |
| 2023 | $5,089 | $167,120 | $20,800 | $146,320 |
| 2022 | $4,481 | $139,400 | $20,800 | $118,600 |
| 2021 | $4,563 | $139,400 | $20,800 | $118,600 |
| 2020 | $4,194 | $119,720 | $20,800 | $98,920 |
| 2019 | $3,818 | $107,960 | $11,200 | $96,760 |
| 2018 | $3,668 | $102,960 | $11,200 | $91,760 |
| 2017 | $3,529 | $97,091 | $11,200 | $85,891 |
| 2016 | $3,546 | $97,091 | $11,200 | $85,891 |
| 2015 | $3,560 | $97,091 | $11,200 | $85,891 |
| 2014 | $2,832 | $76,622 | $11,200 | $65,422 |
| 2013 | -- | $72,632 | $11,200 | $61,432 |
Source: Public Records
Map
Nearby Homes
- 1992 Storey Ln
- 567 Storey Ln
- 525 Storey Ln
- 3686 Highway 129 N
- 545 Jefferson Blvd
- 2144 Hog Mountain Rd
- 445 Katherine Dr
- 430 Katherine Dr
- 2821 Hog Mountain Rd
- 1841 Jett Roberts Rd
- 1817 Jett Roberts Rd
- 544 Academy Woods Dr
- 1681 Jett Roberts Rd
- 514 Adventure Trail
- 750 Jett Roberts Rd
- 899 Rocky Springs Dr
- 279 Adventure Trail
- 273 Hickory Hills Dr
- 17 Castleview Ct
- 2197 Holders Siding Rd
- 23 Eisenhower Ct
- 23 Eisenhower Ct Unit 6
- 658 Washington Pkwy
- 631 Washington Pkwy
- 734 Washington Pkwy (Lot30)
- 39 Eisenhower Ct
- 734 Washington Pkwy
- 622 Washington Pkwy
- 583 Washington Pkwy
- 20 Eisenhower Ct
- 20 Eisenhower Ct Unit 1
- 753 Washington Way Unit 1
- 604 Washington Pkwy
- 47 Eisenhower Ct
- 787 Washington Pkwy
- 210 Washington Pkwy
- 158 Washington Pkwy
- 44 Eisenhower Ct
- 184 Washington Pkwy
- 549 Washington Pkwy