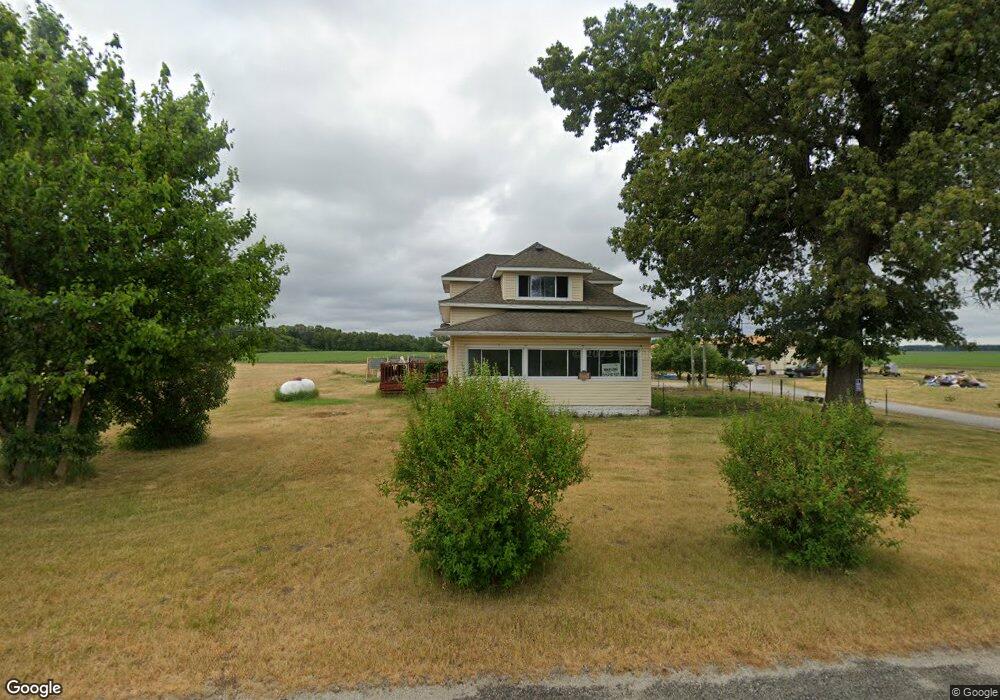
6695 E 400 N Grovertown, IN 46531
Estimated Value: $219,000 - $244,000
4
Beds
2
Baths
2,756
Sq Ft
$85/Sq Ft
Est. Value
About This Home
This home is located at 6695 E 400 N, Grovertown, IN 46531 and is currently estimated at $234,385, approximately $85 per square foot. 6695 E 400 N is a home located in Starke County with nearby schools including Oregon-Davis Elementary School and Oregon-Davis Junior/Senior High School.
Ownership History
Date
Name
Owned For
Owner Type
Purchase Details
Closed on
Sep 26, 2025
Sold by
Petca Ioan
Bought by
Murray Paula K
Current Estimated Value
Purchase Details
Closed on
May 1, 2024
Sold by
Starke County
Purchase Details
Closed on
Dec 22, 2000
Sold by
Sinn Harold D and Sinn Judy
Bought by
Sinn Douglas D and Sinn Paulette
Purchase Details
Closed on
May 4, 2000
Sold by
Nowakowski Sheila A
Bought by
Corbett James J and Corbett Sheila A
Create a Home Valuation Report for This Property
The Home Valuation Report is an in-depth analysis detailing your home's value as well as a comparison with similar homes in the area
Purchase History
| Date | Buyer | Sale Price | Title Company |
|---|---|---|---|
| Murray Paula K | -- | First American Title | |
| -- | $112,756 | None Listed On Document | |
| Sinn Douglas D | -- | -- | |
| Corbett James J | -- | -- |
Source: Public Records
Tax History
| Year | Tax Paid | Tax Assessment Tax Assessment Total Assessment is a certain percentage of the fair market value that is determined by local assessors to be the total taxable value of land and additions on the property. | Land | Improvement |
|---|---|---|---|---|
| 2025 | $3,420 | $234,300 | $34,600 | $199,700 |
| 2024 | $3,420 | $226,400 | $33,100 | $193,300 |
| 2023 | $3,203 | $204,700 | $28,700 | $176,000 |
| 2022 | $3,203 | $189,300 | $25,900 | $163,400 |
| 2021 | $1,191 | $154,500 | $23,700 | $130,800 |
| 2020 | $1,042 | $139,200 | $23,500 | $115,700 |
| 2019 | $971 | $135,800 | $23,100 | $112,700 |
| 2018 | $911 | $131,300 | $22,400 | $108,900 |
| 2017 | $763 | $125,600 | $21,500 | $104,100 |
| 2016 | $707 | $122,300 | $21,300 | $101,000 |
| 2014 | $690 | $126,400 | $21,200 | $105,200 |
| 2013 | $645 | $125,000 | $20,400 | $104,600 |
Source: Public Records
Map
Nearby Homes
Your Personal Tour Guide
Ask me questions while you tour the home.