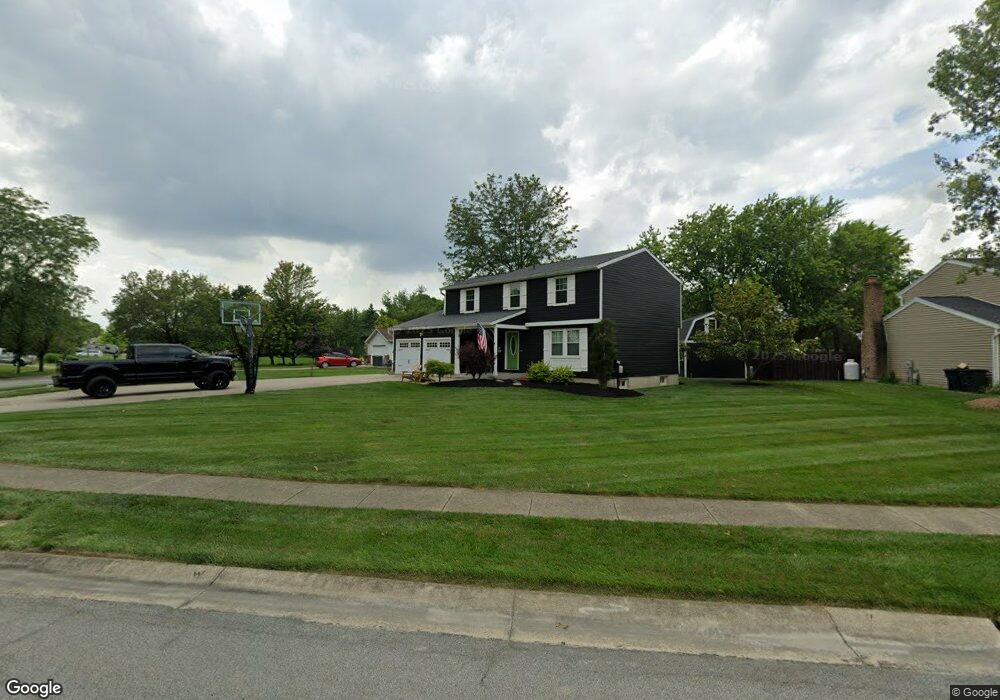
6696 Pin Oak Ct Mason, OH 45040
Deerfield Township NeighborhoodEstimated Value: $377,000 - $414,000
4
Beds
2
Baths
1,786
Sq Ft
$223/Sq Ft
Est. Value
About This Home
This home is located at 6696 Pin Oak Ct, Mason, OH 45040 and is currently estimated at $398,177, approximately $222 per square foot. 6696 Pin Oak Ct is a home located in Warren County with nearby schools including Mason Intermediate Elementary School, Mason Middle School, and William Mason High School.
Ownership History
Date
Name
Owned For
Owner Type
Purchase Details
Closed on
Jan 6, 2001
Sold by
Bates Randy
Bought by
Combs Darin B and Collins Meredith A
Current Estimated Value
Home Financials for this Owner
Home Financials are based on the most recent Mortgage that was taken out on this home.
Original Mortgage
$130,000
Outstanding Balance
$48,765
Interest Rate
7.77%
Mortgage Type
New Conventional
Estimated Equity
$349,412
Purchase Details
Closed on
Aug 7, 1992
Sold by
Ludlow Ludlow and Ludlow Donald E
Bought by
Bates Bates and Bates Randy E
Purchase Details
Closed on
Aug 13, 1986
Sold by
Ryan Homes & Inc
Bought by
Ludlow Ludlow and Ludlow Donald E
Purchase Details
Closed on
Jun 3, 1986
Sold by
Mozzone & Andrew J & Truste
Bought by
Ryan Homes & Inc
Purchase Details
Closed on
Aug 16, 1985
Sold by
Mozzone Mozzone and Mozzone Andrew J.Trustee
Bought by
Mozzone & Andrew J & Truste and Mozzone Andrew J
Create a Home Valuation Report for This Property
The Home Valuation Report is an in-depth analysis detailing your home's value as well as a comparison with similar homes in the area
Home Values in the Area
Average Home Value in this Area
Purchase History
| Date | Buyer | Sale Price | Title Company |
|---|---|---|---|
| Combs Darin B | $148,000 | -- | |
| Bates Bates | $113,900 | -- | |
| Ludlow Ludlow | $80,300 | -- | |
| Ryan Homes & Inc | -- | -- | |
| Mozzone & Andrew J & Truste | -- | -- |
Source: Public Records
Mortgage History
| Date | Status | Borrower | Loan Amount |
|---|---|---|---|
| Open | Combs Darin B | $130,000 |
Source: Public Records
Tax History Compared to Growth
Tax History
| Year | Tax Paid | Tax Assessment Tax Assessment Total Assessment is a certain percentage of the fair market value that is determined by local assessors to be the total taxable value of land and additions on the property. | Land | Improvement |
|---|---|---|---|---|
| 2024 | $4,534 | $106,580 | $28,000 | $78,580 |
| 2023 | $4,221 | $81,802 | $12,810 | $68,992 |
| 2022 | $4,148 | $81,802 | $12,810 | $68,992 |
| 2021 | $3,945 | $81,802 | $12,810 | $68,992 |
| 2020 | $3,807 | $67,050 | $10,500 | $56,550 |
| 2019 | $3,526 | $67,050 | $10,500 | $56,550 |
| 2018 | $3,541 | $67,050 | $10,500 | $56,550 |
| 2017 | $3,169 | $55,360 | $10,423 | $44,937 |
| 2016 | $3,258 | $55,360 | $10,423 | $44,937 |
| 2015 | $3,266 | $55,360 | $10,423 | $44,937 |
| 2014 | $3,214 | $50,330 | $9,470 | $40,850 |
| 2013 | $3,221 | $55,770 | $10,500 | $45,270 |
Source: Public Records
Map
Nearby Homes
- 8224 Summer View Dr
- 8606 Charleston Valley Dr
- 8655 Charleston Creek Dr
- Margot Plan at Losh Landing - Masterpiece Collection
- Mitchell Plan at Losh Landing - Masterpiece Collection
- Clay Plan at Losh Landing - Masterpiece Collection
- Huxley Plan at Losh Landing - Masterpiece Collection
- Leland Plan at Losh Landing - Masterpiece Collection
- Beckett Plan at Losh Landing - Masterpiece Collection
- Paxton Plan at Losh Landing - Masterpiece Collection
- Winslow Plan at Losh Landing - Masterpiece Collection
- Teagan Plan at Losh Landing - Masterpiece Collection
- Pearson Plan at Losh Landing - Masterpiece Collection
- 8905 Suncrest Ln
- 6374 Hunters Green Dr
- 8820 Butler Warren Rd
- 8830 Butler Warren Rd
- 7839 Meadowbrook Dr
- 6589 Quail Lake
- 9302 W Meadow Dr
- 6660 Pin Oak Ct
- 6716 Pin Oak Ct
- 8276 Live Oaks Dr
- 6646 Pin Oak Ct
- 6707 Pin Oak Ct
- 6671 Pin Oak Ct
- 6689 Pin Oak Ct
- 6727 Pin Oak Ct
- 6655 Pin Oak Ct
- 8262 Live Oaks Dr
- 6634 Pin Oak Ct
- 6756 Pin Oak Ct
- 6693 Pin Oak Ct
- 6699 Pin Oak Ct
- 6745 Pin Oak Ct
- 6641 Pin Oak Ct
- 6630 Pin Oak Ct
- 6775 Socialville Foster Rd
- 6730 Sequoia Ct
- 6768 Pin Oak Ct