Estimated Value: $231,110 - $244,000
3
Beds
2
Baths
1,270
Sq Ft
$187/Sq Ft
Est. Value
About This Home
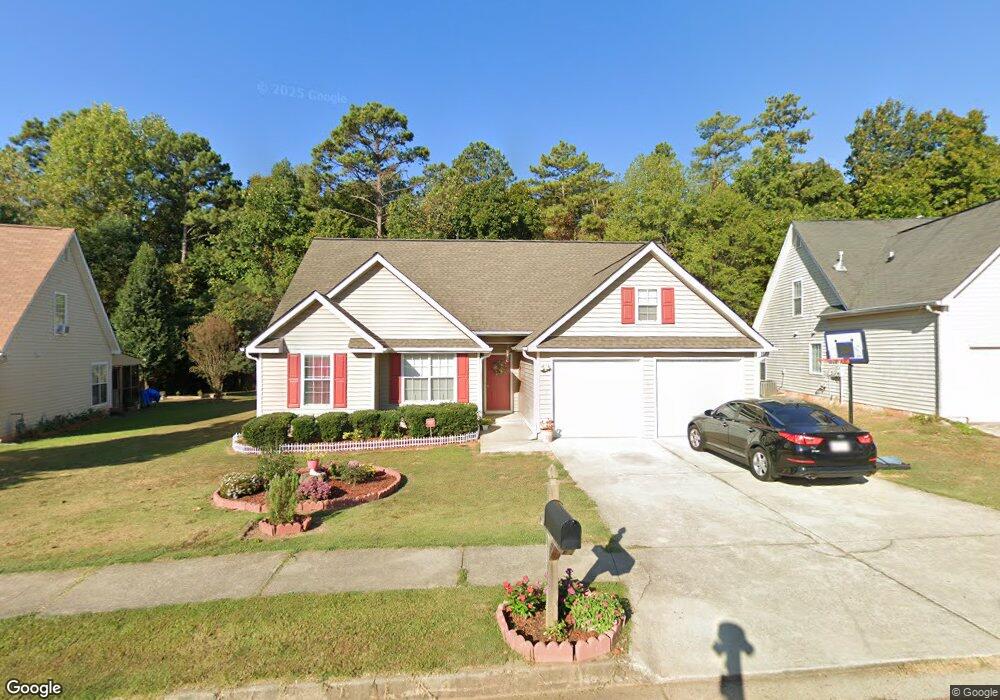
This home is located at 6697 Chesepeake Trail Unit 2, Rex, GA 30273 and is currently estimated at $237,278, approximately $186 per square foot. 6697 Chesepeake Trail Unit 2 is a home located in Clayton County with nearby schools including Roberta T. Smith Elementary School, Rex Mill Middle School, and Mount Zion High School.
Ownership History
Date
Name
Owned For
Owner Type
Purchase Details
Closed on
Feb 8, 2019
Sold by
Ngo Hanh Hong
Bought by
Johnson Elouise D
Current Estimated Value
Home Financials for this Owner
Home Financials are based on the most recent Mortgage that was taken out on this home.
Original Mortgage
$113,199
Outstanding Balance
$98,709
Interest Rate
4.4%
Mortgage Type
New Conventional
Estimated Equity
$138,569
Purchase Details
Closed on
May 23, 2011
Sold by
Federal Home Loan Mortgage Corporation
Bought by
Ngo Hanh H and Nguyen Minh
Purchase Details
Closed on
Dec 7, 2010
Sold by
Citimortgage
Bought by
Federal Home Loan Mortgage Corporation
Purchase Details
Closed on
Feb 4, 2000
Sold by
Knight Group Inc
Bought by
Cross Calvin
Home Financials for this Owner
Home Financials are based on the most recent Mortgage that was taken out on this home.
Original Mortgage
$102,322
Interest Rate
8.29%
Mortgage Type
FHA
Create a Home Valuation Report for This Property
The Home Valuation Report is an in-depth analysis detailing your home's value as well as a comparison with similar homes in the area
Home Values in the Area
Average Home Value in this Area
Purchase History
| Date | Buyer | Sale Price | Title Company |
|---|---|---|---|
| Johnson Elouise D | $116,700 | -- | |
| Ngo Hanh H | -- | -- | |
| Federal Home Loan Mortgage Corporation | -- | -- | |
| Citimortgage | $41,000 | -- | |
| Cross Calvin | $102,900 | -- |
Source: Public Records
Mortgage History
| Date | Status | Borrower | Loan Amount |
|---|---|---|---|
| Open | Johnson Elouise D | $113,199 | |
| Closed | Johnson Elouise D | $4,668 | |
| Previous Owner | Cross Calvin | $102,322 |
Source: Public Records
Tax History
| Year | Tax Paid | Tax Assessment Tax Assessment Total Assessment is a certain percentage of the fair market value that is determined by local assessors to be the total taxable value of land and additions on the property. | Land | Improvement |
|---|---|---|---|---|
| 2025 | $1,631 | $99,200 | $8,800 | $90,400 |
| 2024 | $1,636 | $96,320 | $8,800 | $87,520 |
| 2023 | $3,176 | $87,960 | $8,800 | $79,160 |
| 2022 | $1,089 | $68,600 | $8,800 | $59,800 |
| 2021 | $852 | $55,760 | $8,800 | $46,960 |
| 2020 | $691 | $46,680 | $8,800 | $37,880 |
| 2019 | $1,768 | $42,621 | $6,400 | $36,221 |
| 2018 | $1,443 | $34,614 | $6,400 | $28,214 |
| 2017 | $1,209 | $28,766 | $6,400 | $22,366 |
| 2016 | $1,038 | $24,566 | $6,400 | $18,166 |
| 2015 | $1,231 | $0 | $0 | $0 |
| 2014 | $966 | $23,333 | $6,400 | $16,933 |
Source: Public Records
Map
Nearby Homes
- 6737 Biscayne Blvd
- 6702 Saganaw Dr
- 6773 Biscayne Blvd
- 6608 Chesepeake Trail
- 6604 Chesepeake Trail
- 6667 Sunset Park Unit III
- 6771 Mason Ln
- 3535 Henley St
- 3700 Hudson Ct
- 3601 Bristol Overlook
- 3616 Bristol Overlook
- 3769 Brookwood Blvd
- 3739 Hudson Ct
- 6646 Creek Turn Dr
- 0 Lakeland Rd Unit 7648836
- 0 Lakeland Rd Unit 10603417
- 6968 New Dale Rd
- 6661 Highway 42
- 3403 Hidden Ln
- 6814 Biscayne
- 6689 Chesepeake Trail Unit 2
- 6703 Chesepeake Trail
- 6683 Chesepeake Trail Unit 2
- 6709 Chesepeake Trail Unit 2
- 6698 Chesepeake Trail
- 6690 Chesepeake Trail
- 6677 Chesepeake Trail Unit 2
- 6684 Chesepeake Trail
- 6704 Chesepeake Trail
- 6715 Chesepeake Trail Unit 2
- 6678 Chesepeake Trail Unit 2
- 6671 Chesepeake Trail
- 6671 Chesepeake Trail Unit 196
- 6710 Chesepeake Trail Unit 2
- 6721 Chesepeake Trail
- 6721 Chesepeake Trail
- 6672 Chesepeake Trail
- 6691 Biscayne Blvd Unit 2
- 6685 Biscayne Blvd Unit 2
- 6697 Biscayne Blvd
Your Personal Tour Guide
Ask me questions while you tour the home.