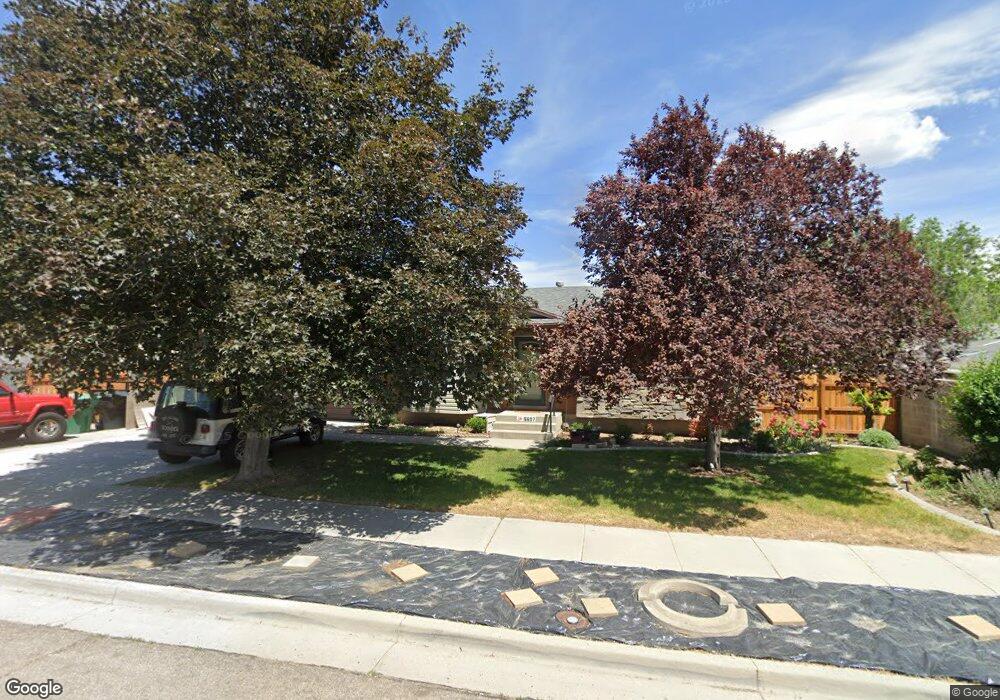
6697 S 5420 W West Jordan, UT 84081
Oquirrh NeighborhoodEstimated Value: $470,000 - $507,746
4
Beds
2
Baths
2,000
Sq Ft
$245/Sq Ft
Est. Value
About This Home
This home is located at 6697 S 5420 W, West Jordan, UT 84081 and is currently estimated at $489,937, approximately $244 per square foot. 6697 S 5420 W is a home located in Salt Lake County with nearby schools including Mountain Shadows School, West Hills Middle School, and Copper Hills High School.
Ownership History
Date
Name
Owned For
Owner Type
Purchase Details
Closed on
Oct 9, 2024
Sold by
Poulos Jennifer
Bought by
Gilbert Todd and Gilbert Connie
Current Estimated Value
Purchase Details
Closed on
Feb 17, 2017
Sold by
Poulos Anthony
Bought by
Poulos Jennifer
Purchase Details
Closed on
Sep 19, 2005
Sold by
Bills Marcia and Bills Jeff K
Bought by
Poulos Anthony and Poulos Jennifer
Home Financials for this Owner
Home Financials are based on the most recent Mortgage that was taken out on this home.
Original Mortgage
$120,800
Interest Rate
6.55%
Mortgage Type
Purchase Money Mortgage
Purchase Details
Closed on
Jun 3, 1996
Sold by
Weaver Murland Lee and Weaver Judy Carleen
Bought by
Bills Marcia and Bills Jeff K
Home Financials for this Owner
Home Financials are based on the most recent Mortgage that was taken out on this home.
Original Mortgage
$110,634
Interest Rate
7.96%
Mortgage Type
FHA
Create a Home Valuation Report for This Property
The Home Valuation Report is an in-depth analysis detailing your home's value as well as a comparison with similar homes in the area
Home Values in the Area
Average Home Value in this Area
Purchase History
| Date | Buyer | Sale Price | Title Company |
|---|---|---|---|
| Gilbert Todd | -- | Title Guarantee Settlement Ser | |
| Poulos Jennifer | -- | None Available | |
| Poulos Anthony | -- | Surety Title | |
| Bills Marcia | -- | -- |
Source: Public Records
Mortgage History
| Date | Status | Borrower | Loan Amount |
|---|---|---|---|
| Previous Owner | Poulos Anthony | $120,800 | |
| Previous Owner | Bills Marcia | $110,634 |
Source: Public Records
Tax History Compared to Growth
Tax History
| Year | Tax Paid | Tax Assessment Tax Assessment Total Assessment is a certain percentage of the fair market value that is determined by local assessors to be the total taxable value of land and additions on the property. | Land | Improvement |
|---|---|---|---|---|
| 2025 | $2,485 | $488,700 | $135,700 | $353,000 |
| 2024 | $2,485 | $420,000 | $128,000 | $292,000 |
| 2023 | $2,485 | $393,800 | $123,100 | $270,700 |
| 2022 | $2,410 | $380,400 | $120,700 | $259,700 |
| 2021 | $2,135 | $312,900 | $92,800 | $220,100 |
| 2020 | $1,985 | $271,700 | $92,800 | $178,900 |
| 2019 | $1,946 | $260,500 | $87,600 | $172,900 |
| 2018 | $1,821 | $240,600 | $87,600 | $153,000 |
| 2017 | $1,638 | $213,200 | $87,600 | $125,600 |
| 2016 | $1,627 | $199,200 | $87,600 | $111,600 |
| 2015 | $1,601 | $189,100 | $83,900 | $105,200 |
| 2014 | $1,570 | $182,200 | $81,300 | $100,900 |
Source: Public Records
Map
Nearby Homes
- 5281 Saguaro Dr
- 6839 S Cyclamen Dr
- 5557 W Joshua Cir
- 5466 Ticklegrass Rd
- 6853 Mullien Dr Unit 5420
- 6489 S Daffodil Way
- 5183 W Cadenza Dr
- 6568 S 5180 W
- 5581 Bluevail Ct
- 6922 Mullien Dr
- 7758 S Iron Core Ln
- 7146 W Owens View Way Unit 204
- 7259 W Cibola Rd
- 6739 S Sol Rise Dr
- 5579 W Lopalena Cir
- 6721 Adventure Way
- 6706 Marshrock Rd
- 5732 W Moon Crest Ct
- 6635 S Milfoil Cir
- 6928 Beargrass Rd
- 6685 S 5420 W
- 5398 W Saguaro Dr
- 5398 Saguaro Dr
- 6678 Verano Cir
- 6684 S Verano Cir
- 5408 Saguaro Dr
- 6684 Verano Cir
- 6704 S 5420 W
- 6692 S 5420 W
- 5388 Saguaro Dr
- 6671 S 5420 W
- 6682 S 5420 W
- 6670 S Verano Cir
- 6670 Verano Cir
- 5378 Saguaro Dr
- 5428 Saguaro Dr
- 6733 S Crus Corvi Rd
- 6659 S 5420 W
- 6670 S 5420 W
- 6733 Crus Corvi Rd