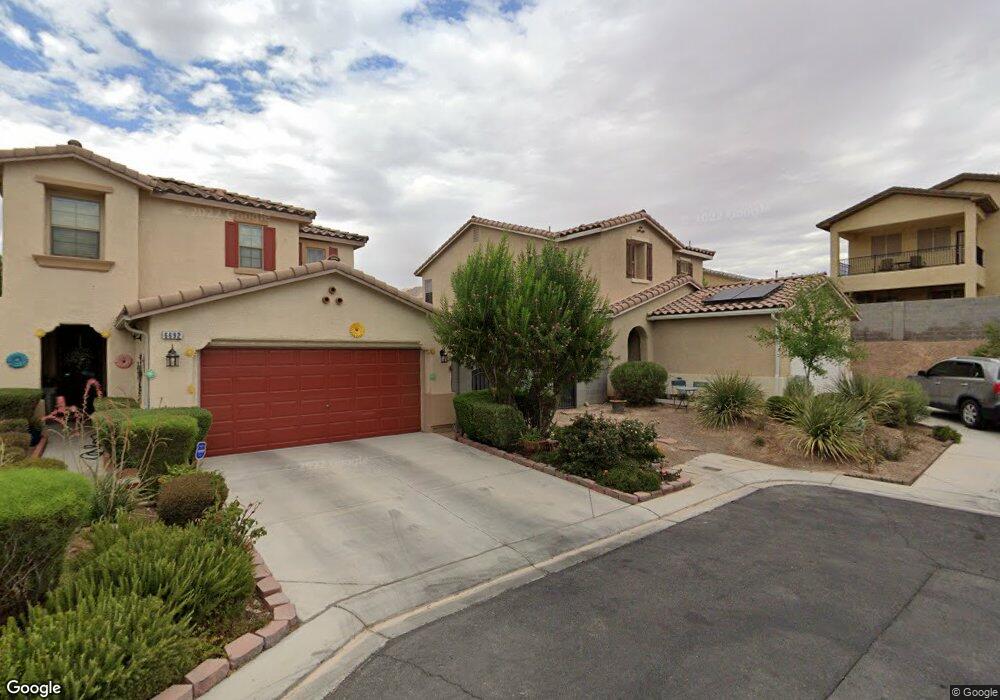
6698 Chariots Path Ct Las Vegas, NV 89142
Estimated Value: $450,000 - $491,000
4
Beds
3
Baths
1,942
Sq Ft
$241/Sq Ft
Est. Value
About This Home
This home is located at 6698 Chariots Path Ct, Las Vegas, NV 89142 and is currently estimated at $467,836, approximately $240 per square foot. 6698 Chariots Path Ct is a home located in Clark County with nearby schools including Jenkins Earl N. Elementary School, Kathleen & Tim Harney Middle School, and Las Vegas High School.
Ownership History
Date
Name
Owned For
Owner Type
Purchase Details
Closed on
Jan 21, 2016
Sold by
Iraheta Carlos Alberto
Bought by
Iraheta Isabel Carmen
Current Estimated Value
Purchase Details
Closed on
Nov 19, 2012
Sold by
Iraheta Isabel C
Bought by
Iraheta Carlos A
Purchase Details
Closed on
Feb 11, 2008
Sold by
Iraheta Carlos A
Bought by
Iraheta Isabel C
Purchase Details
Closed on
May 18, 2007
Sold by
Iraheta Ana Maria
Bought by
Iraheta Carlos A
Home Financials for this Owner
Home Financials are based on the most recent Mortgage that was taken out on this home.
Original Mortgage
$263,700
Outstanding Balance
$159,962
Interest Rate
6.12%
Mortgage Type
Unknown
Estimated Equity
$307,874
Purchase Details
Closed on
May 10, 2007
Sold by
Pardee Homes Of Nevada
Bought by
Iraheta Carlos A
Home Financials for this Owner
Home Financials are based on the most recent Mortgage that was taken out on this home.
Original Mortgage
$263,700
Outstanding Balance
$159,962
Interest Rate
6.12%
Mortgage Type
Unknown
Estimated Equity
$307,874
Create a Home Valuation Report for This Property
The Home Valuation Report is an in-depth analysis detailing your home's value as well as a comparison with similar homes in the area
Home Values in the Area
Average Home Value in this Area
Purchase History
| Date | Buyer | Sale Price | Title Company |
|---|---|---|---|
| Iraheta Isabel Carmen | -- | None Available | |
| Iraheta Carlos A | -- | None Available | |
| Iraheta Isabel C | -- | None Available | |
| Iraheta Carlos A | -- | Chicago Title | |
| Iraheta Carlos A | $329,625 | Chicago Title |
Source: Public Records
Mortgage History
| Date | Status | Borrower | Loan Amount |
|---|---|---|---|
| Open | Iraheta Carlos A | $263,700 |
Source: Public Records
Tax History Compared to Growth
Tax History
| Year | Tax Paid | Tax Assessment Tax Assessment Total Assessment is a certain percentage of the fair market value that is determined by local assessors to be the total taxable value of land and additions on the property. | Land | Improvement |
|---|---|---|---|---|
| 2025 | $2,460 | $148,013 | $29,645 | $118,368 |
| 2024 | $2,573 | $148,013 | $29,645 | $118,368 |
| 2023 | $2,573 | $143,290 | $32,725 | $110,565 |
| 2022 | $2,539 | $131,229 | $30,030 | $101,199 |
| 2021 | $2,440 | $120,703 | $29,645 | $91,058 |
| 2020 | $2,111 | $115,282 | $23,100 | $92,182 |
| 2019 | $1,978 | $103,248 | $21,175 | $82,073 |
| 2018 | $1,888 | $95,042 | $19,600 | $75,442 |
| 2017 | $2,048 | $69,841 | $16,800 | $53,041 |
| 2016 | $1,433 | $58,418 | $13,650 | $44,768 |
| 2015 | $1,294 | $46,749 | $11,900 | $34,849 |
| 2014 | $1,254 | $47,143 | $7,875 | $39,268 |
Source: Public Records
Map
Nearby Homes
- 6679 Chariots Path Ct
- 2695 Upland Bluff Dr
- 2807 Lindsey Springs St
- 2767 Lindsey Springs St
- 2671 S Colina Bella Ct
- 6829 Painted Morning Ave
- 2836 Amphion Ct
- 6860 Upland Heights Ave
- 6863 Upland Heights Ave
- 2593 Indigo Cloud Ct
- 6580 Clara Bow Ave Unit 103
- 2796 Sipe Springs St
- 2621 Rainbow River Dr
- 6471 Dune Point Ct
- 2539 Early Light Dr
- 2659 Upland Dawn Ct
- 2676 Upland Dawn Ct
- 6578 Charlie Chaplin Ave Unit 102
- 6433 Buck Jones Ave Unit 103
- 2664 Painted Mist Ct
- 6692 Chariots Path Ct
- 2825 Murray Hills Ln
- 2831 Murray Hill Ln
- 2831 Murray Hills Ln
- 2819 Murray Hill Ln
- 6686 Chariots Path Ct
- 2837 Murray Hill Ln
- 6689 Apollos Gate Ct
- 6695 Apollos Gate Ct
- 6695 Apollos Gate Ct Unit n/a
- 2813 Murray Hill Ln
- 6697 Chariots Path Ct
- 6680 Chariots Path Ct
- 2843 Murray Hill Ln
- 6683 Apollos Gate Ct
- 6691 Chariots Path Ct
- 2807 Murray Hill Ln Unit 40I
- 6685 Chariots Path Ct Unit 402
- 6677 Apollos Gate Ct
- 6674 Chariots Path Ct