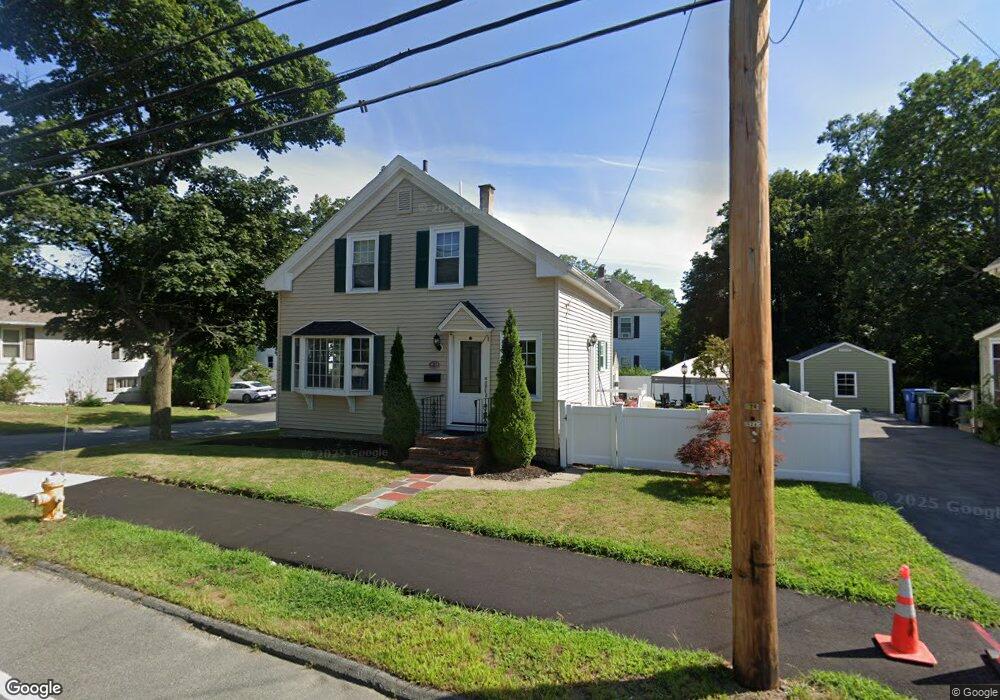
66A Hobart St Danvers, MA 01923
Estimated Value: $533,000 - $646,000
3
Beds
2
Baths
938
Sq Ft
$638/Sq Ft
Est. Value
About This Home
This home is located at 66A Hobart St, Danvers, MA 01923 and is currently estimated at $598,339, approximately $637 per square foot. 66A Hobart St is a home located in Essex County with nearby schools including St. Mary of the Annunciation School and St. John's Prep.
Ownership History
Date
Name
Owned For
Owner Type
Purchase Details
Closed on
Jul 6, 2016
Sold by
Peppe Danny V
Bought by
Peppe Danny V and Peppe Micayla
Current Estimated Value
Home Financials for this Owner
Home Financials are based on the most recent Mortgage that was taken out on this home.
Original Mortgage
$215,000
Outstanding Balance
$171,966
Interest Rate
3.64%
Mortgage Type
New Conventional
Estimated Equity
$426,373
Purchase Details
Closed on
Mar 30, 2012
Sold by
Picillo Vincent E Est and Picillo
Bought by
Peppe Danny V
Purchase Details
Closed on
Feb 13, 2009
Sold by
Picillo Shirley
Bought by
Picillo Dana E
Create a Home Valuation Report for This Property
The Home Valuation Report is an in-depth analysis detailing your home's value as well as a comparison with similar homes in the area
Home Values in the Area
Average Home Value in this Area
Purchase History
| Date | Buyer | Sale Price | Title Company |
|---|---|---|---|
| Peppe Danny V | -- | -- | |
| Peppe Danny V | -- | -- | |
| Picillo Dana E | -- | -- |
Source: Public Records
Mortgage History
| Date | Status | Borrower | Loan Amount |
|---|---|---|---|
| Open | Peppe Danny V | $215,000 | |
| Previous Owner | Picillo Dana E | $30,000 |
Source: Public Records
Tax History Compared to Growth
Tax History
| Year | Tax Paid | Tax Assessment Tax Assessment Total Assessment is a certain percentage of the fair market value that is determined by local assessors to be the total taxable value of land and additions on the property. | Land | Improvement |
|---|---|---|---|---|
| 2025 | $5,329 | $484,900 | $293,800 | $191,100 |
| 2024 | $5,331 | $479,800 | $293,800 | $186,000 |
| 2023 | $5,055 | $430,200 | $260,600 | $169,600 |
| 2022 | $4,865 | $384,300 | $227,300 | $157,000 |
| 2021 | $4,590 | $343,800 | $206,200 | $137,600 |
| 2020 | $4,246 | $325,100 | $199,600 | $125,500 |
| 2019 | $4,262 | $320,900 | $192,900 | $128,000 |
| 2018 | $4,044 | $298,700 | $187,400 | $111,300 |
| 2017 | $3,987 | $281,000 | $174,100 | $106,900 |
| 2016 | $3,833 | $269,900 | $166,300 | $103,600 |
| 2015 | $3,565 | $239,100 | $144,100 | $95,000 |
Source: Public Records
Map
Nearby Homes
- 14 Williams St Unit C17
- 37 Holten St Unit 2
- 6 Kimberly Dr
- 25 Cherry St Unit 3
- 11 Holten St
- 8 Putnam St Unit 3
- 12 Whipple St
- 20 Ash St Unit 3
- 20 Ash St Unit 1
- 5 Beacon St
- 63 Adams St
- 35 High St Unit 3D
- 35 Locust St Unit 3
- 14 1/2 Hampshire St
- 38 High St Unit 4
- 5 Hampshire St
- 22 Collins St Unit 31
- 20 Collins St Unit B
- 37 Constitution Ln Unit 12
- 1 Robert Rd