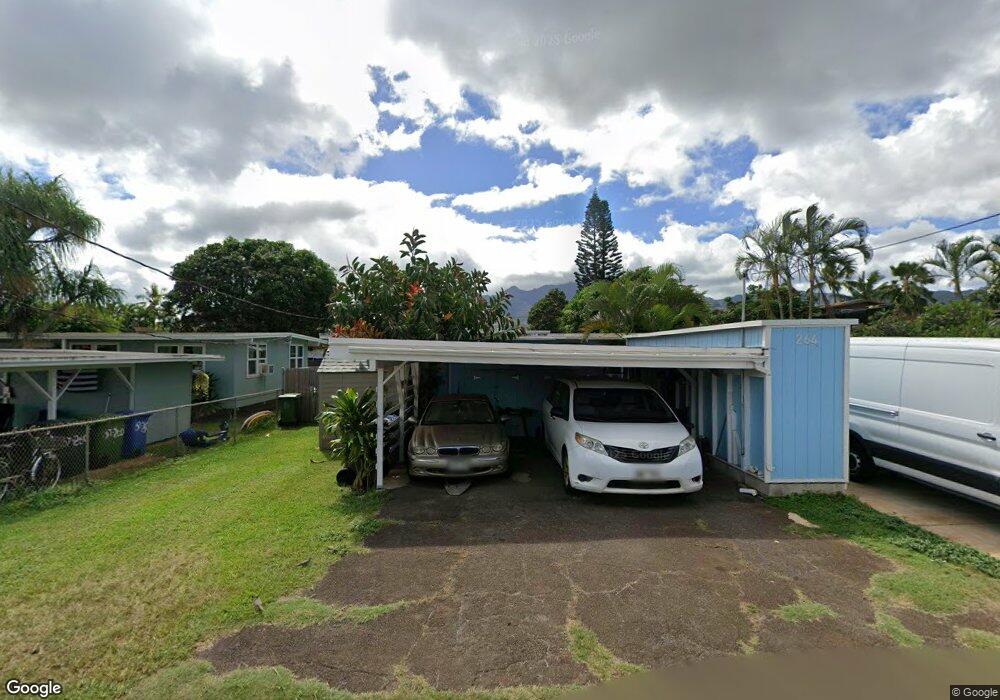
67-264 Kahaone Loop Waialua, HI 96791
Estimated Value: $1,091,555 - $1,581,000
5
Beds
2
Baths
1,152
Sq Ft
$1,230/Sq Ft
Est. Value
About This Home
This home is located at 67-264 Kahaone Loop, Waialua, HI 96791 and is currently estimated at $1,416,389, approximately $1,229 per square foot. 67-264 Kahaone Loop is a home located in Honolulu County with nearby schools including Waialua Elementary School and Waialua High & Intermediate School.
Ownership History
Date
Name
Owned For
Owner Type
Purchase Details
Closed on
May 27, 2022
Sold by
J And A Bush Family Trust
Bought by
Bush David Richard
Current Estimated Value
Home Financials for this Owner
Home Financials are based on the most recent Mortgage that was taken out on this home.
Original Mortgage
$718,000
Outstanding Balance
$682,159
Interest Rate
5.1%
Mortgage Type
Balloon
Estimated Equity
$734,230
Purchase Details
Closed on
Oct 6, 2019
Sold by
Bush Jefferson Patrick
Bought by
Bush Jefferson P and Bush Annya P
Purchase Details
Closed on
Apr 30, 2019
Sold by
Ajirogi Sally T and The Stanley C T Ajiroge Revoca
Bought by
Bush Jefferson Patrick
Home Financials for this Owner
Home Financials are based on the most recent Mortgage that was taken out on this home.
Original Mortgage
$562,500
Interest Rate
4.2%
Mortgage Type
New Conventional
Create a Home Valuation Report for This Property
The Home Valuation Report is an in-depth analysis detailing your home's value as well as a comparison with similar homes in the area
Home Values in the Area
Average Home Value in this Area
Purchase History
| Date | Buyer | Sale Price | Title Company |
|---|---|---|---|
| Bush David Richard | -- | Premier Title | |
| Bush David Richard | -- | Premier Title | |
| Bush Jefferson P | -- | None Available | |
| Bush Jefferson P | -- | None Available | |
| Bush Jefferson P | -- | None Available | |
| Bush Jefferson Patrick | $750,000 | Fam |
Source: Public Records
Mortgage History
| Date | Status | Borrower | Loan Amount |
|---|---|---|---|
| Open | Bush David Richard | $718,000 | |
| Closed | Bush David Richard | $718,000 | |
| Previous Owner | Bush Jefferson Patrick | $562,500 |
Source: Public Records
Tax History Compared to Growth
Tax History
| Year | Tax Paid | Tax Assessment Tax Assessment Total Assessment is a certain percentage of the fair market value that is determined by local assessors to be the total taxable value of land and additions on the property. | Land | Improvement |
|---|---|---|---|---|
| 2025 | $4,956 | $1,067,000 | $911,900 | $155,100 |
| 2024 | $4,956 | $1,083,900 | $911,900 | $172,000 |
| 2023 | $5,731 | $1,151,800 | $911,900 | $239,900 |
| 2022 | $3,400 | $971,400 | $740,900 | $230,500 |
| 2021 | $3,163 | $907,900 | $683,900 | $224,000 |
| 2020 | $3,004 | $858,300 | $655,400 | $202,900 |
| 2019 | $2,657 | $866,600 | $655,400 | $211,200 |
| 2018 | $2,657 | $759,200 | $524,300 | $234,900 |
| 2017 | $2,169 | $619,700 | $455,900 | $163,800 |
| 2016 | $2,003 | $572,200 | $399,000 | $173,200 |
| 2015 | $1,753 | $500,900 | $353,400 | $147,500 |
| 2014 | -- | $461,800 | $330,600 | $131,200 |
Source: Public Records
Map
Nearby Homes
- 67-267 Kahaone Loop Unit 2
- 67-241 Kahaone Loop
- 67-238 Kahaone Loop
- 67-003 Kahaone Place
- 67-4 Kahaone Place Unit A
- 68-077 Au St Unit 3E
- 68-090 Au St Unit E312
- 68-090 Au St Unit E505
- 68-024 Apuhihi St Unit W301
- 68-121 Au St Unit 506
- 68-121 Au St Unit 403
- 68-078 Au St Unit 203
- 68-046 Apuhihi St Unit B
- 68-24 Apuhihi St Unit 303
- 68-159 Au St Unit 9
- 68-159 Au St Unit 209
- 68-159 Au St Unit 2
- 68-055 Akule St Unit 501
- 68-055 Akule St Unit 402
- 66-471 Pikai St
- 67-260 Kahaone Loop
- 67-260 Kahaone Loop Unit B
- 67-268 Kahaone Loop
- 67-254 Kahaone Loop
- 67272 Kahaone Loop
- 67-249 Kiapoko St
- 67-272 Kahaone Loop
- 67-259 Kiapoko St
- 67-245 Kiapoko St
- 67250 Kahaone Loop Unit A
- 67-250 Kahaone Loop
- 67-263 Kahaone Loop
- 67-263 Kiapoko St
- 67-278 Kahaone Loop
- 67-278 Kahaone Loop Unit B
- 67-259 Kahaone Loop
- 67-267 Kahaone Loop
- 67-255 Kahaone Loop
- 67-241 Kiapoko St
- 67-271 Kahaone Loop