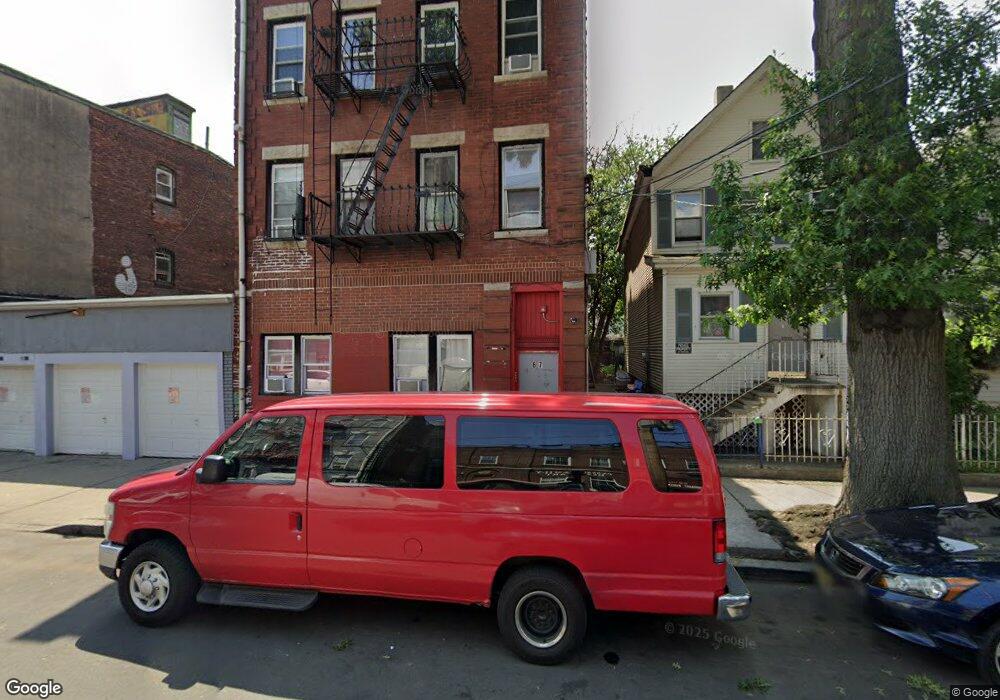
67 3rd St Passaic, NJ 07055
Estimated Value: $995,000 - $1,447,854
--
Bed
--
Bath
--
Sq Ft
2,483
Sq Ft Lot
About This Home
This home is located at 67 3rd St, Passaic, NJ 07055 and is currently estimated at $1,284,618. 67 3rd St is a home with nearby schools including Little Falls Township Public School No. 2, Little Falls School No. 3, and Little Falls School No. 1.
Ownership History
Date
Name
Owned For
Owner Type
Purchase Details
Closed on
Nov 21, 2023
Sold by
67 3Rd Street Nj Llc
Bought by
Passaic 3Rd St Llc
Current Estimated Value
Purchase Details
Closed on
Nov 26, 2019
Sold by
Villar Jorge G and Fernandez Magdalena
Bought by
67 3Rd Street N Llc
Home Financials for this Owner
Home Financials are based on the most recent Mortgage that was taken out on this home.
Original Mortgage
$4,530
Interest Rate
3.5%
Mortgage Type
Purchase Money Mortgage
Purchase Details
Closed on
Jan 11, 1994
Sold by
Levinsohn Rose
Bought by
Villan Jorge
Create a Home Valuation Report for This Property
The Home Valuation Report is an in-depth analysis detailing your home's value as well as a comparison with similar homes in the area
Home Values in the Area
Average Home Value in this Area
Purchase History
Date | Buyer | Sale Price | Title Company |
---|---|---|---|
Passaic 3Rd St Llc | $1,350,000 | Riverview Title | |
67 3Rd Street N Llc | $975,000 | Meister Abstract Corp | |
Villan Jorge | $120,000 | -- |
Source: Public Records
Mortgage History
Date | Status | Borrower | Loan Amount |
---|---|---|---|
Previous Owner | 67 3Rd Street N Llc | $4,530 |
Source: Public Records
Tax History Compared to Growth
Tax History
Year | Tax Paid | Tax Assessment Tax Assessment Total Assessment is a certain percentage of the fair market value that is determined by local assessors to be the total taxable value of land and additions on the property. | Land | Improvement |
---|---|---|---|---|
2024 | $25,141 | $627,900 | $52,500 | $575,400 |
2022 | $25,359 | $652,900 | $52,500 | $600,400 |
2021 | $24,549 | $652,900 | $52,500 | $600,400 |
2020 | $24,360 | $652,900 | $52,500 | $600,400 |
2019 | $24,007 | $652,900 | $52,500 | $600,400 |
2018 | $23,491 | $652,900 | $52,500 | $600,400 |
2017 | $22,767 | $652,900 | $52,500 | $600,400 |
2016 | $21,990 | $652,900 | $52,500 | $600,400 |
2015 | $13,442 | $177,500 | $63,000 | $114,500 |
2014 | $13,195 | $177,500 | $63,000 | $114,500 |
Source: Public Records
Map
Nearby Homes