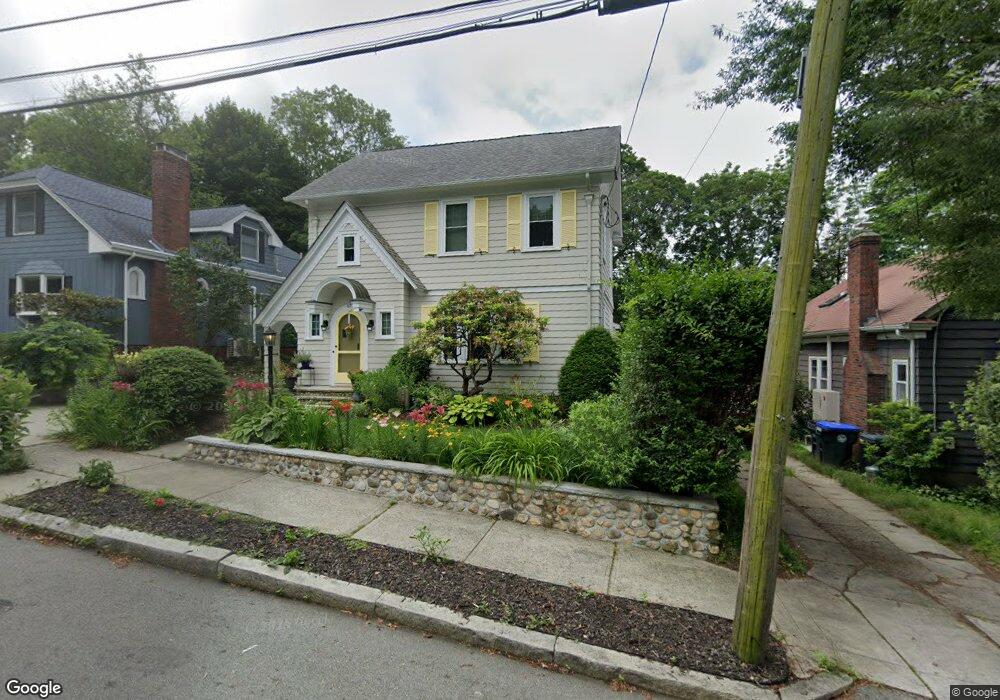
67 3rd St Providence, RI 02906
Hope NeighborhoodEstimated Value: $652,000 - $785,000
3
Beds
2
Baths
1,557
Sq Ft
$467/Sq Ft
Est. Value
About This Home
This home is located at 67 3rd St, Providence, RI 02906 and is currently estimated at $726,671, approximately $466 per square foot. 67 3rd St is a home located in Providence County with nearby schools including Jewish Community Day School Of Rhode Island, Moses Brown School, and Ocean Tides School.
Ownership History
Date
Name
Owned For
Owner Type
Purchase Details
Closed on
Jul 26, 2004
Sold by
Alter Albert
Bought by
Obrien Erin K
Current Estimated Value
Home Financials for this Owner
Home Financials are based on the most recent Mortgage that was taken out on this home.
Original Mortgage
$29,350
Interest Rate
6.28%
Create a Home Valuation Report for This Property
The Home Valuation Report is an in-depth analysis detailing your home's value as well as a comparison with similar homes in the area
Home Values in the Area
Average Home Value in this Area
Purchase History
| Date | Buyer | Sale Price | Title Company |
|---|---|---|---|
| Obrien Erin K | $294,000 | -- |
Source: Public Records
Mortgage History
| Date | Status | Borrower | Loan Amount |
|---|---|---|---|
| Open | Obrien Erin K | $306,000 | |
| Closed | Obrien Erin K | $66,000 | |
| Closed | Obrien Erin K | $29,350 | |
| Closed | Obrien Erin K | $235,200 |
Source: Public Records
Tax History
| Year | Tax Paid | Tax Assessment Tax Assessment Total Assessment is a certain percentage of the fair market value that is determined by local assessors to be the total taxable value of land and additions on the property. | Land | Improvement |
|---|---|---|---|---|
| 2025 | $5,376 | $640,000 | $372,600 | $267,400 |
| 2024 | $9,520 | $518,800 | $251,100 | $267,700 |
| 2023 | $9,520 | $518,800 | $251,100 | $267,700 |
| 2022 | $9,235 | $518,800 | $251,100 | $267,700 |
| 2021 | $9,433 | $384,100 | $202,700 | $181,400 |
| 2020 | $9,433 | $384,100 | $202,700 | $181,400 |
| 2019 | $9,433 | $384,100 | $202,700 | $181,400 |
| 2018 | $10,636 | $332,800 | $175,500 | $157,300 |
| 2017 | $10,636 | $332,800 | $175,500 | $157,300 |
| 2016 | $10,636 | $332,800 | $175,500 | $157,300 |
| 2015 | $9,844 | $297,400 | $163,800 | $133,600 |
| 2014 | $10,037 | $297,400 | $163,800 | $133,600 |
| 2013 | $10,020 | $296,900 | $163,800 | $133,100 |
Source: Public Records
Map
Nearby Homes
Your Personal Tour Guide
Ask me questions while you tour the home.