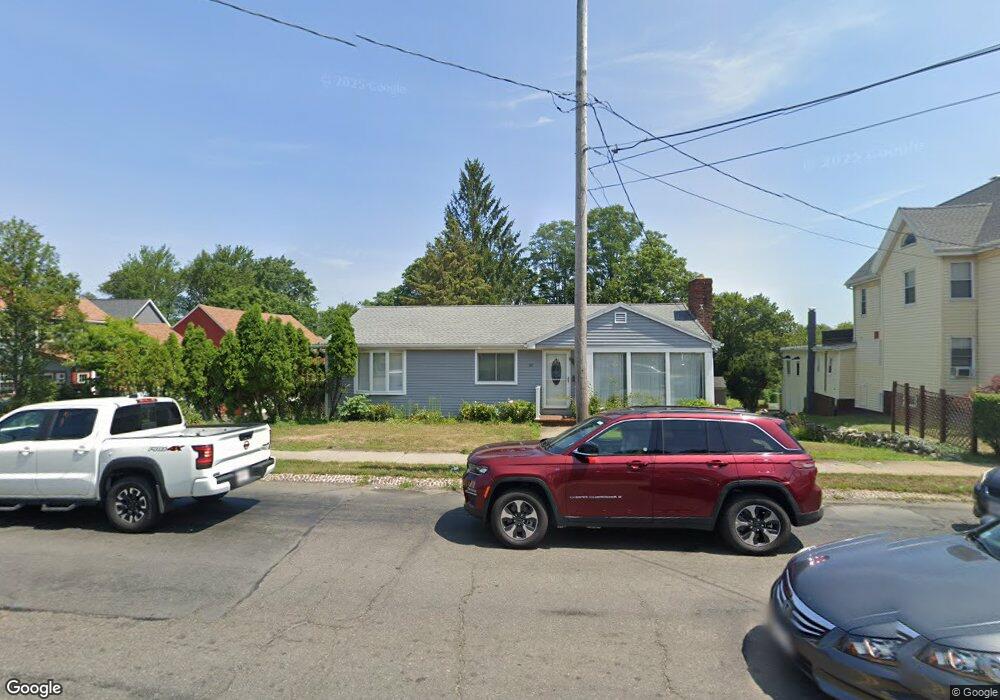
67 Andover St Peabody, MA 01960
Estimated Value: $643,000 - $675,954
3
Beds
2
Baths
1,485
Sq Ft
$445/Sq Ft
Est. Value
About This Home
This home is located at 67 Andover St, Peabody, MA 01960 and is currently estimated at $660,739, approximately $444 per square foot. 67 Andover St is a home located in Essex County with nearby schools including Peabody Veterans Memorial High School, St John The Baptist School, and Bishop Fenwick High School.
Ownership History
Date
Name
Owned For
Owner Type
Purchase Details
Closed on
Sep 4, 2009
Sold by
Santana Yrving R
Bought by
Santana Yrving R
Current Estimated Value
Home Financials for this Owner
Home Financials are based on the most recent Mortgage that was taken out on this home.
Original Mortgage
$241,656
Outstanding Balance
$158,203
Interest Rate
5.21%
Mortgage Type
Purchase Money Mortgage
Estimated Equity
$502,536
Purchase Details
Closed on
Mar 20, 2007
Sold by
Mostacci Linda S and Foote Stephen J
Bought by
Foote Stephen J
Purchase Details
Closed on
Aug 26, 2004
Sold by
Mostacci Linda
Bought by
Mostacci Linda S
Purchase Details
Closed on
Feb 23, 1993
Sold by
Rogers Jimmy H and Rogers Nancy A
Bought by
Mostacci Linda S
Create a Home Valuation Report for This Property
The Home Valuation Report is an in-depth analysis detailing your home's value as well as a comparison with similar homes in the area
Home Values in the Area
Average Home Value in this Area
Purchase History
| Date | Buyer | Sale Price | Title Company |
|---|---|---|---|
| Santana Yrving R | -- | -- | |
| Santana Yrving R | $250,000 | -- | |
| Foote Stephen J | -- | -- | |
| Mostacci Linda S | -- | -- | |
| Mostacci Linda S | $90,000 | -- |
Source: Public Records
Mortgage History
| Date | Status | Borrower | Loan Amount |
|---|---|---|---|
| Open | Mostacci Linda S | $241,656 | |
| Previous Owner | Mostacci Linda S | $22,771 | |
| Previous Owner | Mostacci Linda S | $207,500 |
Source: Public Records
Tax History Compared to Growth
Tax History
| Year | Tax Paid | Tax Assessment Tax Assessment Total Assessment is a certain percentage of the fair market value that is determined by local assessors to be the total taxable value of land and additions on the property. | Land | Improvement |
|---|---|---|---|---|
| 2025 | $5,618 | $606,700 | $218,900 | $387,800 |
| 2024 | $5,237 | $574,200 | $218,900 | $355,300 |
| 2023 | $5,063 | $531,800 | $195,500 | $336,300 |
| 2022 | $4,023 | $398,300 | $174,600 | $223,700 |
| 2021 | $3,982 | $379,600 | $158,700 | $220,900 |
| 2020 | $4,283 | $398,800 | $158,700 | $240,100 |
| 2019 | $4,030 | $366,000 | $158,700 | $207,300 |
| 2018 | $3,774 | $329,300 | $144,300 | $185,000 |
| 2017 | $3,663 | $311,500 | $144,300 | $167,200 |
| 2016 | $3,575 | $299,900 | $144,300 | $155,600 |
| 2015 | $3,300 | $268,300 | $140,700 | $127,600 |
Source: Public Records
Map
Nearby Homes