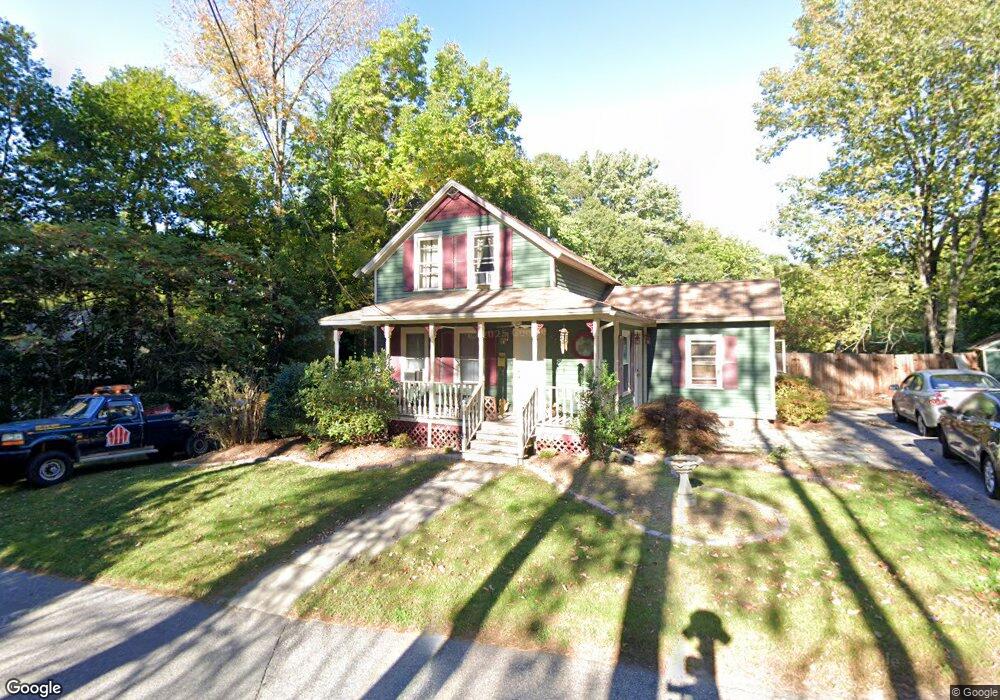
67 Auburn St Cherry Valley, MA 01611
Estimated Value: $253,000 - $381,000
4
Beds
1
Bath
886
Sq Ft
$369/Sq Ft
Est. Value
About This Home
This home is located at 67 Auburn St, Cherry Valley, MA 01611 and is currently estimated at $326,849, approximately $368 per square foot. 67 Auburn St is a home located in Worcester County with nearby schools including Leicester Integrated Preschool, Leicester Memorial Elementary School, and Leicester Middle School.
Ownership History
Date
Name
Owned For
Owner Type
Purchase Details
Closed on
Feb 11, 2022
Sold by
Merchant Mark R
Bought by
Merchant Jo A and Merchant Mark R
Current Estimated Value
Home Financials for this Owner
Home Financials are based on the most recent Mortgage that was taken out on this home.
Original Mortgage
$147,600
Outstanding Balance
$117,731
Interest Rate
2.79%
Mortgage Type
Stand Alone Refi Refinance Of Original Loan
Estimated Equity
$209,118
Purchase Details
Closed on
Jul 16, 1998
Sold by
West Melvin D and West Beverly J
Bought by
Merchant Mark R and Merchant Donna M
Home Financials for this Owner
Home Financials are based on the most recent Mortgage that was taken out on this home.
Original Mortgage
$102,500
Interest Rate
6.98%
Mortgage Type
Purchase Money Mortgage
Purchase Details
Closed on
Oct 30, 1996
Sold by
Est Lemieux Anna M and Lemieux Daniel G
Bought by
West Melvin D and West Beverly
Create a Home Valuation Report for This Property
The Home Valuation Report is an in-depth analysis detailing your home's value as well as a comparison with similar homes in the area
Home Values in the Area
Average Home Value in this Area
Purchase History
| Date | Buyer | Sale Price | Title Company |
|---|---|---|---|
| Merchant Jo A | -- | None Available | |
| Merchant Jo A | -- | None Available | |
| Merchant Mark R | $102,500 | -- | |
| West Melvin D | $20,000 | -- | |
| West Melvin D | $20,000 | -- | |
| Merchant Mark R | $102,500 | -- | |
| West Melvin D | $20,000 | -- |
Source: Public Records
Mortgage History
| Date | Status | Borrower | Loan Amount |
|---|---|---|---|
| Open | Merchant Jo A | $147,600 | |
| Previous Owner | West Melvin D | $102,500 |
Source: Public Records
Tax History Compared to Growth
Tax History
| Year | Tax Paid | Tax Assessment Tax Assessment Total Assessment is a certain percentage of the fair market value that is determined by local assessors to be the total taxable value of land and additions on the property. | Land | Improvement |
|---|---|---|---|---|
| 2025 | $33 | $282,600 | $77,500 | $205,100 |
| 2024 | $3,139 | $250,100 | $67,100 | $183,000 |
| 2023 | $3,007 | $233,800 | $67,100 | $166,700 |
| 2022 | $2,924 | $209,000 | $64,100 | $144,900 |
| 2021 | $3,026 | $200,000 | $64,100 | $135,900 |
| 2020 | $2,566 | $172,100 | $63,200 | $108,900 |
| 2019 | $2,365 | $156,800 | $56,600 | $100,200 |
| 2018 | $2,314 | $143,800 | $56,600 | $87,200 |
| 2017 | $2,226 | $143,800 | $56,600 | $87,200 |
| 2016 | $2,184 | $146,600 | $70,600 | $76,000 |
| 2015 | $2,132 | $146,600 | $70,600 | $76,000 |
Source: Public Records
Map
Nearby Homes
- 42 Upton St
- 500 Main St
- 23 South St
- 19 South St
- 118 Mccarthy Ave
- 135 Henshaw St
- 46 Locust St
- 1560 Main St
- 1511 Main St Unit C405
- 1511 Main St Unit C306
- 1 Ludlow St
- 45 Ledgecrest Dr
- 24 Ludlow St
- 3 Mildred Ave
- 26 Mildred Ave Unit 26
- 26 Mildred Ave
- 39a Timrod Dr
- 285 Henshaw St
- 27 Winslow Ave
- 993 N Main St