Estimated Value: $233,576 - $303,000
3
Beds
1
Bath
1,404
Sq Ft
$188/Sq Ft
Est. Value
About This Home
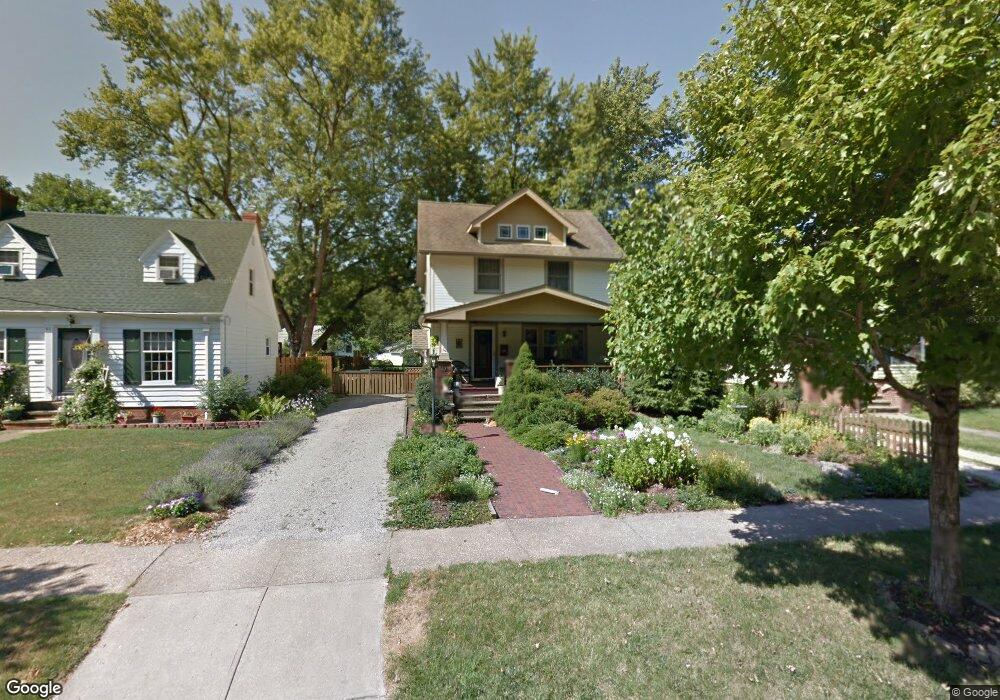
This home is located at 67 Baker St, Berea, OH 44017 and is currently estimated at $263,394, approximately $187 per square foot. 67 Baker St is a home located in Cuyahoga County with nearby schools including Grindstone Elementary School, Berea-Midpark Middle School, and Berea-Midpark High School.
Ownership History
Date
Name
Owned For
Owner Type
Purchase Details
Closed on
Jul 18, 2016
Sold by
Shank Edwin R and Shank Katherine E
Bought by
Shank Edwin R and Shank Katherine E
Current Estimated Value
Purchase Details
Closed on
Oct 28, 1999
Sold by
Shank Edwin R and Shank Katherine E
Bought by
Shank Edwin R and Shank Katherine E
Purchase Details
Closed on
Aug 31, 1990
Sold by
Duncan Keith T
Bought by
Shank Edwin R
Purchase Details
Closed on
Jun 13, 1985
Sold by
Adams Gordon and Adams Sherman
Bought by
Duncan Keith T
Purchase Details
Closed on
Jul 7, 1982
Sold by
Adms Genevieve T
Bought by
Adams Gordon and Adams Sherman
Purchase Details
Closed on
May 18, 1981
Sold by
Blackman Cornelius P
Bought by
Adms Genevieve T
Purchase Details
Closed on
Jan 1, 1975
Bought by
Blackman Cornelius P
Create a Home Valuation Report for This Property
The Home Valuation Report is an in-depth analysis detailing your home's value as well as a comparison with similar homes in the area
Home Values in the Area
Average Home Value in this Area
Purchase History
| Date | Buyer | Sale Price | Title Company |
|---|---|---|---|
| Shank Edwin R | -- | Attorney | |
| Shank Edwin R | -- | -- | |
| Shank Edwin R | $79,000 | -- | |
| Duncan Keith T | $17,500 | -- | |
| Adams Gordon | -- | -- | |
| Adms Genevieve T | $14,000 | -- | |
| Blackman Cornelius P | -- | -- |
Source: Public Records
Tax History
| Year | Tax Paid | Tax Assessment Tax Assessment Total Assessment is a certain percentage of the fair market value that is determined by local assessors to be the total taxable value of land and additions on the property. | Land | Improvement |
|---|---|---|---|---|
| 2024 | $4,677 | $81,060 | $12,040 | $69,020 |
| 2023 | $3,648 | $52,820 | $10,120 | $42,700 |
| 2022 | $3,625 | $52,815 | $10,115 | $42,700 |
| 2021 | $3,594 | $52,820 | $10,120 | $42,700 |
| 2020 | $3,434 | $44,770 | $8,580 | $36,190 |
| 2019 | $3,342 | $127,900 | $24,500 | $103,400 |
| 2018 | $3,325 | $44,770 | $8,580 | $36,190 |
| 2017 | $3,289 | $41,160 | $8,190 | $32,970 |
| 2016 | $3,050 | $38,400 | $8,190 | $30,210 |
| 2015 | $2,862 | $38,400 | $8,190 | $30,210 |
| 2014 | $2,882 | $38,400 | $8,190 | $30,210 |
Source: Public Records
Map
Nearby Homes
Your Personal Tour Guide
Ask me questions while you tour the home.