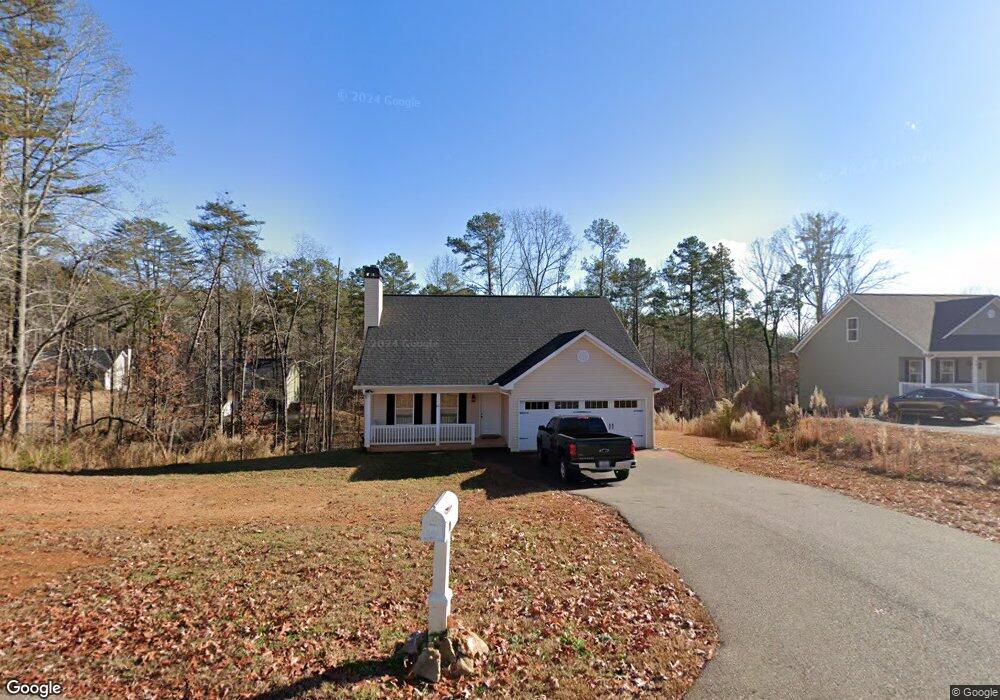
67 Baker St Unit 45 Dahlonega, GA 30533
Estimated Value: $428,000 - $478,000
3
Beds
3
Baths
1,976
Sq Ft
$228/Sq Ft
Est. Value
About This Home
This home is located at 67 Baker St Unit 45, Dahlonega, GA 30533 and is currently estimated at $450,129, approximately $227 per square foot. 67 Baker St Unit 45 is a home located in Lumpkin County with nearby schools including Lumpkin County High School.
Ownership History
Date
Name
Owned For
Owner Type
Purchase Details
Closed on
Jul 1, 2021
Sold by
Mar Kell Llc
Bought by
Goss Matthew Cody
Current Estimated Value
Home Financials for this Owner
Home Financials are based on the most recent Mortgage that was taken out on this home.
Original Mortgage
$285,300
Outstanding Balance
$258,866
Interest Rate
2.9%
Mortgage Type
New Conventional
Estimated Equity
$191,264
Purchase Details
Closed on
Nov 5, 2020
Sold by
Holly Milton Heath
Bought by
Mar Kell Llc
Home Financials for this Owner
Home Financials are based on the most recent Mortgage that was taken out on this home.
Original Mortgage
$258,387
Interest Rate
2.8%
Mortgage Type
Commercial
Purchase Details
Closed on
Apr 9, 2019
Sold by
Hayes Greg
Bought by
Holly Milton Heath
Home Financials for this Owner
Home Financials are based on the most recent Mortgage that was taken out on this home.
Original Mortgage
$218,828
Interest Rate
4.3%
Mortgage Type
Commercial
Purchase Details
Closed on
Sep 1, 2005
Bought by
Hayes Greg and Hayes Ricky
Create a Home Valuation Report for This Property
The Home Valuation Report is an in-depth analysis detailing your home's value as well as a comparison with similar homes in the area
Home Values in the Area
Average Home Value in this Area
Purchase History
| Date | Buyer | Sale Price | Title Company |
|---|---|---|---|
| Goss Matthew Cody | $317,000 | -- | |
| Mar Kell Llc | $223,150 | -- | |
| Holly Milton Heath | $235,000 | -- | |
| Hayes Greg | $811,000 | -- |
Source: Public Records
Mortgage History
| Date | Status | Borrower | Loan Amount |
|---|---|---|---|
| Open | Goss Matthew Cody | $285,300 | |
| Previous Owner | Mar Kell Llc | $258,387 | |
| Previous Owner | Holly Milton Heath | $218,828 |
Source: Public Records
Tax History Compared to Growth
Tax History
| Year | Tax Paid | Tax Assessment Tax Assessment Total Assessment is a certain percentage of the fair market value that is determined by local assessors to be the total taxable value of land and additions on the property. | Land | Improvement |
|---|---|---|---|---|
| 2024 | $3,542 | $149,381 | $8,000 | $141,381 |
| 2023 | $3,297 | $140,190 | $8,000 | $132,190 |
| 2022 | $2,997 | $121,076 | $6,000 | $115,076 |
| 2021 | $2,345 | $91,618 | $6,000 | $85,618 |
| 2020 | $2,355 | $89,260 | $6,000 | $83,260 |
| 2019 | $2,376 | $89,260 | $6,000 | $83,260 |
| 2018 | $170 | $6,000 | $6,000 | $0 |
| 2017 | $130 | $4,500 | $4,500 | $0 |
| 2016 | $135 | $4,500 | $4,500 | $0 |
| 2015 | $119 | $4,500 | $4,500 | $0 |
| 2014 | $119 | $4,500 | $4,500 | $0 |
| 2013 | -- | $4,500 | $4,500 | $0 |
Source: Public Records
Map
Nearby Homes
- 15 Baker St
- 103 Rainmore Dr
- 191 Sleepy Hollow Rd
- 0 Rainmore Dr Unit 7620063
- 0 Rainmore Dr Unit 10570615
- 190 Grand Oak Ln
- 221 Laurel Cir
- 486 Laurel Cir
- Lot 5 Still Rd
- 251 Bearslide Hollow
- 0 Honey Tree Terrace Unit 10448792
- 0 Honey Tree Terrace Unit 7516071
- 150 Buck Run E
- 239 Castleberry Ln
- 194 Deerfield Dr
- 460 Morgan Ln
- 1044 Rider Rd
- 437 Morgan Ln
- 33 T J Mote Rd
- 33 Tj Mote Rd
- 67 Baker St
- 17 Baker St
- 17 Baker St Unit 46
- 115 Baker St
- 15 Baker St Unit 47
- 48 Baker St
- 47 Baker St
- 46 Baker St
- 91 Baker St
- 13 Baker St
- 13 Baker St Unit 48
- 126 Baker St
- 96 Baker St
- 60 Baker St
- 80 Baker St
- 28 Baker St
- 285 Brookwoods Ln Unit 49
- 285 Brookwoods Ln
- 138 Baker St
- 312 Brookwoods Ln Unit 25