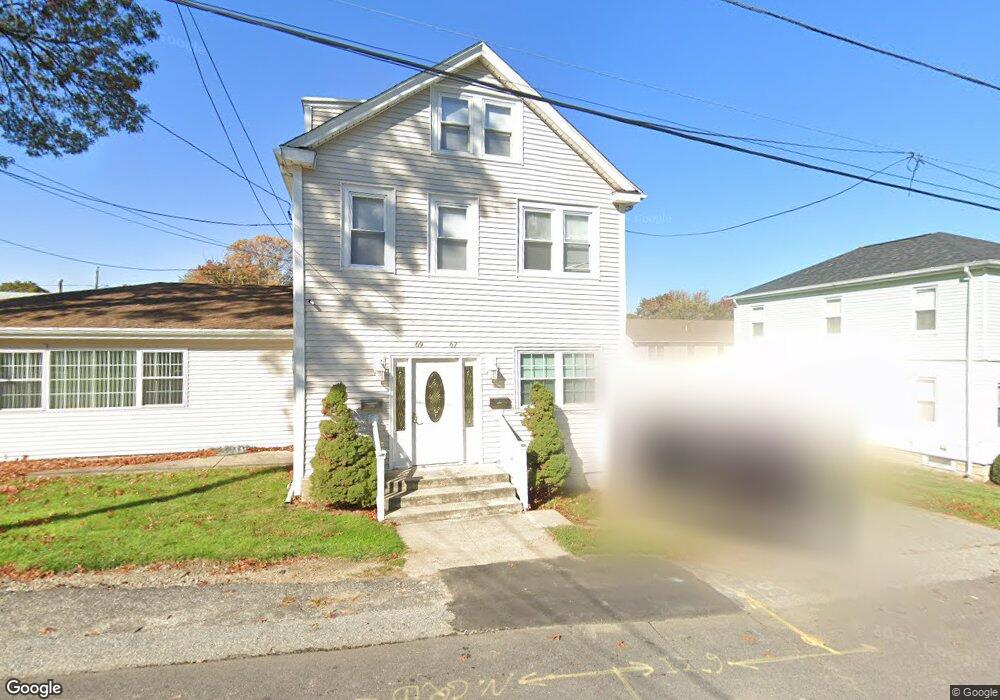
67 Barrett Ave Unit 69 North Providence, RI 02904
Geneva NeighborhoodEstimated Value: $526,000 - $677,693
4
Beds
3
Baths
2,436
Sq Ft
$257/Sq Ft
Est. Value
About This Home
This home is located at 67 Barrett Ave Unit 69, North Providence, RI 02904 and is currently estimated at $624,923, approximately $256 per square foot. 67 Barrett Ave Unit 69 is a home located in Providence County with nearby schools including North Providence High School, St. Thomas Regional School, and St. Augustine School.
Ownership History
Date
Name
Owned For
Owner Type
Purchase Details
Closed on
Apr 7, 2023
Sold by
Arcieri Patricia
Bought by
Mclean Robert J and Torrance Mary
Current Estimated Value
Home Financials for this Owner
Home Financials are based on the most recent Mortgage that was taken out on this home.
Original Mortgage
$521,977
Outstanding Balance
$507,203
Interest Rate
6.5%
Mortgage Type
FHA
Estimated Equity
$117,721
Purchase Details
Closed on
Jan 19, 1990
Sold by
68-69 Barrett Ave R
Bought by
Lopez Rodrigo
Home Financials for this Owner
Home Financials are based on the most recent Mortgage that was taken out on this home.
Original Mortgage
$88,000
Interest Rate
9.68%
Create a Home Valuation Report for This Property
The Home Valuation Report is an in-depth analysis detailing your home's value as well as a comparison with similar homes in the area
Home Values in the Area
Average Home Value in this Area
Purchase History
| Date | Buyer | Sale Price | Title Company |
|---|---|---|---|
| Mclean Robert J | $540,000 | None Available | |
| Lopez Rodrigo | $110,000 | -- | |
| Lopez Rodrigo | $110,000 | -- |
Source: Public Records
Mortgage History
| Date | Status | Borrower | Loan Amount |
|---|---|---|---|
| Open | Mclean Robert J | $521,977 | |
| Previous Owner | Lopez Rodrigo | $40,000 | |
| Previous Owner | Lopez Rodrigo | $88,000 |
Source: Public Records
Tax History Compared to Growth
Tax History
| Year | Tax Paid | Tax Assessment Tax Assessment Total Assessment is a certain percentage of the fair market value that is determined by local assessors to be the total taxable value of land and additions on the property. | Land | Improvement |
|---|---|---|---|---|
| 2024 | $6,739 | $405,700 | $76,500 | $329,200 |
| 2023 | $6,739 | $405,700 | $76,500 | $329,200 |
| 2022 | $6,845 | $300,100 | $64,800 | $235,300 |
| 2021 | $6,845 | $300,100 | $64,800 | $235,300 |
| 2020 | $6,845 | $300,100 | $64,800 | $235,300 |
| 2017 | $5,346 | $204,500 | $58,700 | $145,800 |
| 2016 | $5,147 | $184,200 | $51,400 | $132,800 |
| 2015 | $5,147 | $184,200 | $51,400 | $132,800 |
| 2014 | $5,147 | $184,200 | $51,400 | $132,800 |
Source: Public Records
Map
Nearby Homes
- 35 Malcolm St
- 42 Salem Dr
- 145 Smithfield Rd Unit B
- 300 Smithfield Rd Unit B5-52
- 300 Smithfield Rd Unit 30
- 50 Cushing St
- 59 Alexander St
- 16 Tremont St
- 1560 Douglas Ave Unit F79
- 36 Primrose Ln
- 4 Smithfield Rd Unit 21
- 1166 Douglas Ave
- 1 Benjamin Dr
- 252 Gentian Ave
- 19 Fisher St
- 18 Tuscola Ave
- 45 Countryside Dr
- 68 Pearl Ave
- 73 High Service Ave
- 1117 Douglas Ave Unit 511