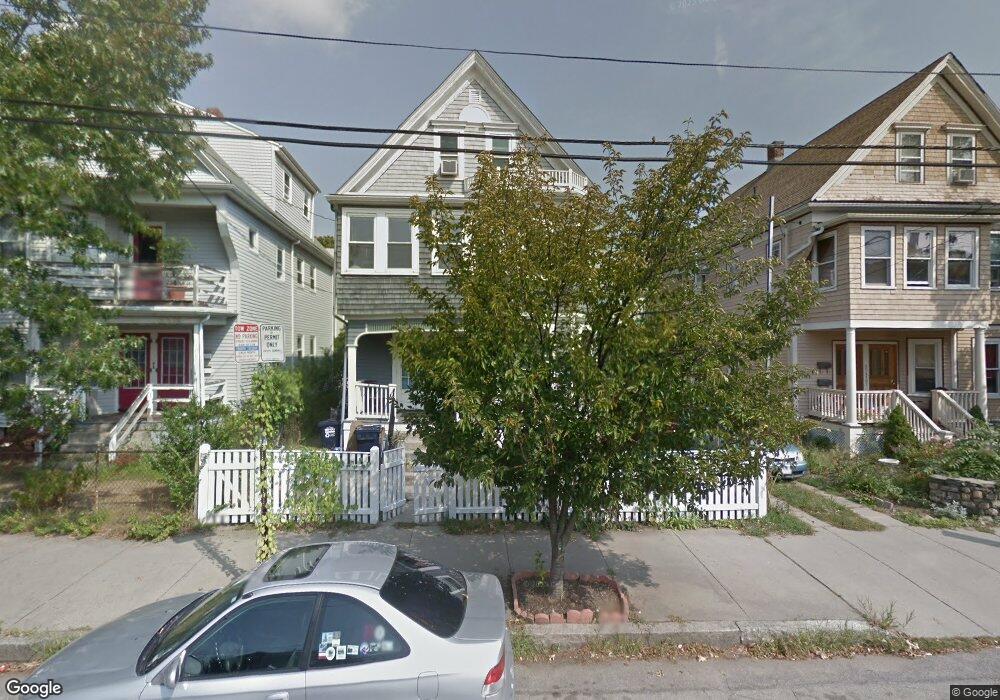
67 Belmont St Unit 69 Cambridge, MA 02138
Strawberry Hill NeighborhoodEstimated Value: $1,309,000 - $1,689,000
5
Beds
3
Baths
2,264
Sq Ft
$646/Sq Ft
Est. Value
About This Home
This home is located at 67 Belmont St Unit 69, Cambridge, MA 02138 and is currently estimated at $1,462,783, approximately $646 per square foot. 67 Belmont St Unit 69 is a home located in Middlesex County with nearby schools including Atrium School, St. Stephen's Armenian Elementary School, and Shady Hill School.
Ownership History
Date
Name
Owned For
Owner Type
Purchase Details
Closed on
Aug 30, 2023
Sold by
Ryan Bonnie A
Bought by
Lannon Danny J and Lannon Cory J
Current Estimated Value
Purchase Details
Closed on
Jun 30, 2014
Sold by
Ryan Bonnie A and Lannon John D
Bought by
Ryan Bonnie A
Home Financials for this Owner
Home Financials are based on the most recent Mortgage that was taken out on this home.
Original Mortgage
$272,000
Interest Rate
4.19%
Mortgage Type
New Conventional
Purchase Details
Closed on
May 18, 2001
Sold by
Stigberg Kathleen M
Bought by
Ryan Bonnie A and Lannon John D
Home Financials for this Owner
Home Financials are based on the most recent Mortgage that was taken out on this home.
Original Mortgage
$348,500
Interest Rate
7.03%
Mortgage Type
Purchase Money Mortgage
Purchase Details
Closed on
Mar 31, 1992
Sold by
Debral Rlty Inc
Bought by
Stigberg Kathleen M
Purchase Details
Closed on
Oct 2, 1991
Sold by
Tarvezian George K
Bought by
Debral Rlty Inc
Create a Home Valuation Report for This Property
The Home Valuation Report is an in-depth analysis detailing your home's value as well as a comparison with similar homes in the area
Home Values in the Area
Average Home Value in this Area
Purchase History
| Date | Buyer | Sale Price | Title Company |
|---|---|---|---|
| Lannon Danny J | -- | None Available | |
| Ryan Bonnie A | -- | -- | |
| Ryan Bonnie A | $474,000 | -- | |
| Stigberg Kathleen M | $139,900 | -- | |
| Stigberg Kathleen M | $139,900 | -- | |
| Debral Rlty Inc | $125,000 | -- | |
| Debral Rlty Inc | $125,000 | -- |
Source: Public Records
Mortgage History
| Date | Status | Borrower | Loan Amount |
|---|---|---|---|
| Previous Owner | Ryan Bonnie A | $272,000 | |
| Previous Owner | Debral Rlty Inc | $300,000 | |
| Previous Owner | Debral Rlty Inc | $348,500 |
Source: Public Records
Tax History Compared to Growth
Tax History
| Year | Tax Paid | Tax Assessment Tax Assessment Total Assessment is a certain percentage of the fair market value that is determined by local assessors to be the total taxable value of land and additions on the property. | Land | Improvement |
|---|---|---|---|---|
| 2025 | $7,550 | $1,189,000 | $512,300 | $676,700 |
| 2024 | $7,015 | $1,185,000 | $533,600 | $651,400 |
| 2023 | $6,537 | $1,115,500 | $544,300 | $571,200 |
| 2022 | $6,224 | $1,051,300 | $535,400 | $515,900 |
| 2021 | $6,047 | $1,033,600 | $537,200 | $496,400 |
| 2020 | $5,798 | $1,008,400 | $521,400 | $487,000 |
| 2019 | $5,487 | $923,800 | $465,400 | $458,400 |
| 2018 | $2,984 | $802,500 | $391,900 | $410,600 |
| 2017 | $5,049 | $778,000 | $367,400 | $410,600 |
| 2016 | $4,894 | $700,100 | $318,400 | $381,700 |
| 2015 | $4,835 | $618,300 | $279,900 | $338,400 |
| 2014 | $4,588 | $547,500 | $245,000 | $302,500 |
Source: Public Records
Map
Nearby Homes
- 25 Francis St Unit 2
- 25 Francis St Unit 1
- 16 Ericsson St
- 66 Holworthy St
- 163 Belmont St
- 87 Holworthy St Unit 2
- 87 Holworthy St Unit 3
- 10 Marlboro St Unit 1
- 30 Unity Ave Unit 30
- 161 Cushing St
- 35 Homer Ave Unit 7
- 47 Homer Ave Unit 5-3
- 87 Templeton Pkwy Unit 3
- 1 Aberdeen Way Unit 113
- 238 Arlington St Unit 238
- 56-58 Edgecliff Rd
- 43 Irma Ave Unit 43
- 1 Clayton St
- 133 Hillside Rd
- 73 Foster Rd Unit 2
- 71 Belmont St Unit 73
- 63 Belmont St
- 8 Norman St
- 9 Norumbega St
- 7 Norumbega St Unit 7
- 12 Norman St
- 11 Norumbega St
- 79 Belmont St
- 53 Belmont St Unit 55
- 53 Belmont St Unit 2
- 9 Norman St Unit 9
- 7 Norman St
- 8 Norumbega St
- 16 Norman St Unit 18
- 16-18 Norman St
- 10 Norumbega St
- 83-85 Belmont St
- 51 Belmont St
- 51 Belmont St Unit 550 - 22
- 83 Belmont St Unit 85