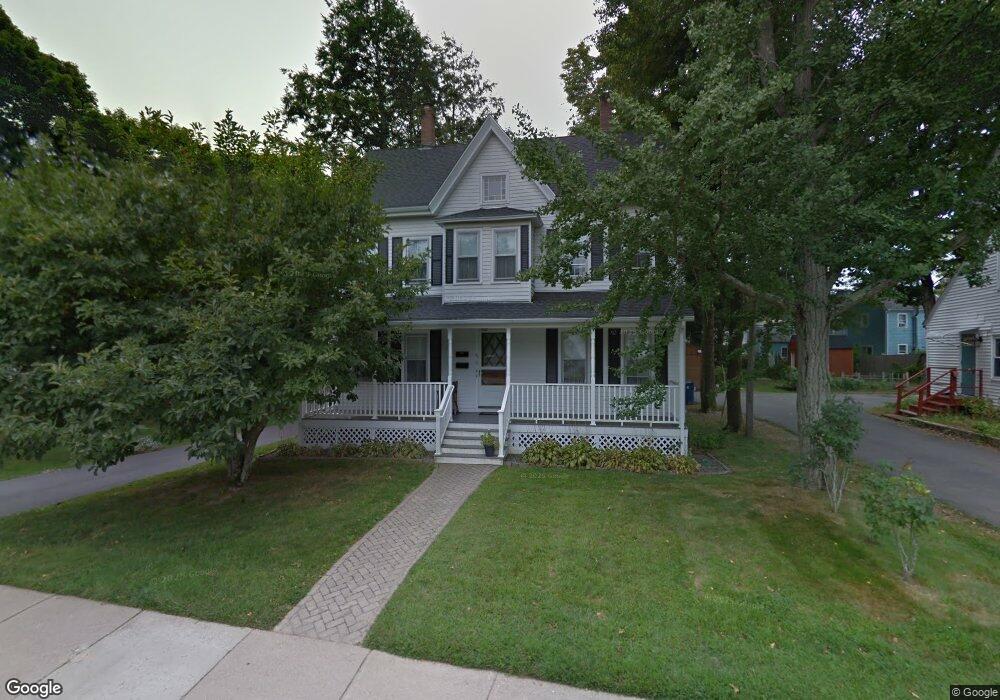
67 Billings St Sharon, MA 02067
Estimated Value: $768,000 - $915,000
7
Beds
2
Baths
2,301
Sq Ft
$359/Sq Ft
Est. Value
About This Home
This home is located at 67 Billings St, Sharon, MA 02067 and is currently estimated at $825,677, approximately $358 per square foot. 67 Billings St is a home located in Norfolk County with nearby schools including Cottage Street Elementary School, Sharon Middle School, and Sharon High School.
Ownership History
Date
Name
Owned For
Owner Type
Purchase Details
Closed on
Jul 11, 2019
Sold by
Kaufman Julie
Bought by
Julie Kaufman T 2016
Current Estimated Value
Purchase Details
Closed on
Sep 21, 2017
Sold by
Dorothy Kaufman 2003 T
Bought by
Kaufman Julie
Create a Home Valuation Report for This Property
The Home Valuation Report is an in-depth analysis detailing your home's value as well as a comparison with similar homes in the area
Home Values in the Area
Average Home Value in this Area
Purchase History
| Date | Buyer | Sale Price | Title Company |
|---|---|---|---|
| Julie Kaufman T 2016 | -- | -- | |
| Kaufman Julie | -- | -- |
Source: Public Records
Tax History Compared to Growth
Tax History
| Year | Tax Paid | Tax Assessment Tax Assessment Total Assessment is a certain percentage of the fair market value that is determined by local assessors to be the total taxable value of land and additions on the property. | Land | Improvement |
|---|---|---|---|---|
| 2025 | $10,829 | $619,500 | $370,400 | $249,100 |
| 2024 | $10,353 | $588,900 | $339,800 | $249,100 |
| 2023 | $10,751 | $578,300 | $317,600 | $260,700 |
| 2022 | $10,511 | $532,200 | $264,600 | $267,600 |
| 2021 | $10,190 | $498,800 | $249,700 | $249,100 |
| 2020 | $9,477 | $498,800 | $249,700 | $249,100 |
| 2019 | $8,451 | $435,400 | $220,900 | $214,500 |
| 2018 | $8,343 | $430,700 | $216,600 | $214,100 |
| 2017 | $8,174 | $416,600 | $202,500 | $214,100 |
| 2016 | $8,486 | $422,000 | $202,500 | $219,500 |
| 2015 | $7,921 | $390,200 | $185,700 | $204,500 |
| 2014 | $7,336 | $357,000 | $168,800 | $188,200 |
Source: Public Records
Map
Nearby Homes
- 32 Billings St Unit A
- 49 Cottage St
- 137 Pond St
- 29 Station St
- 16 Forest Rd
- 150 Pond St
- 54 Depot St
- 5 Trowel Pond Shop Rd Unit C
- 148 S Main St
- 7 Ashcroft Rd
- 47 Ashcroft Rd
- 136 N Main St
- 15 Paul Revere Rd
- 2 Rhodes Ave
- 3 Trowel Shop Pond Rd Unit 3
- 20 Trowel Shop Pond Rd Unit 24
- 16 Trowel Shop Pond Rd Unit 16
- 2 Trowel Shop Pond Rd Unit 2
- 8 Trowel Shop Pond Rd Unit 8
- 12 Trowel Shop Pond Rd Unit 12
- 73 Billings St
- 63 Billings St
- 63 Billings St Unit 2
- 63 Billings St Unit 1
- 28 Maple Ave
- 5 Summit Ave
- 32 Maple Ave
- 20 Maple Ave
- 68 Billings St Unit 1
- 64 Billings St
- 66 Billings St Unit 3
- 15 Summit Ave
- 77 Billings St
- 8 Summit Ave
- 8 Summit Ave
- 8 Summit Ave Unit 1
- 8 Summit Ave Unit 2
- 25 Maple Ave
- 29 Maple Ave
- 10 Summit Ave