Estimated Value: $323,000 - $361,000
--
Bed
--
Bath
1,992
Sq Ft
$169/Sq Ft
Est. Value
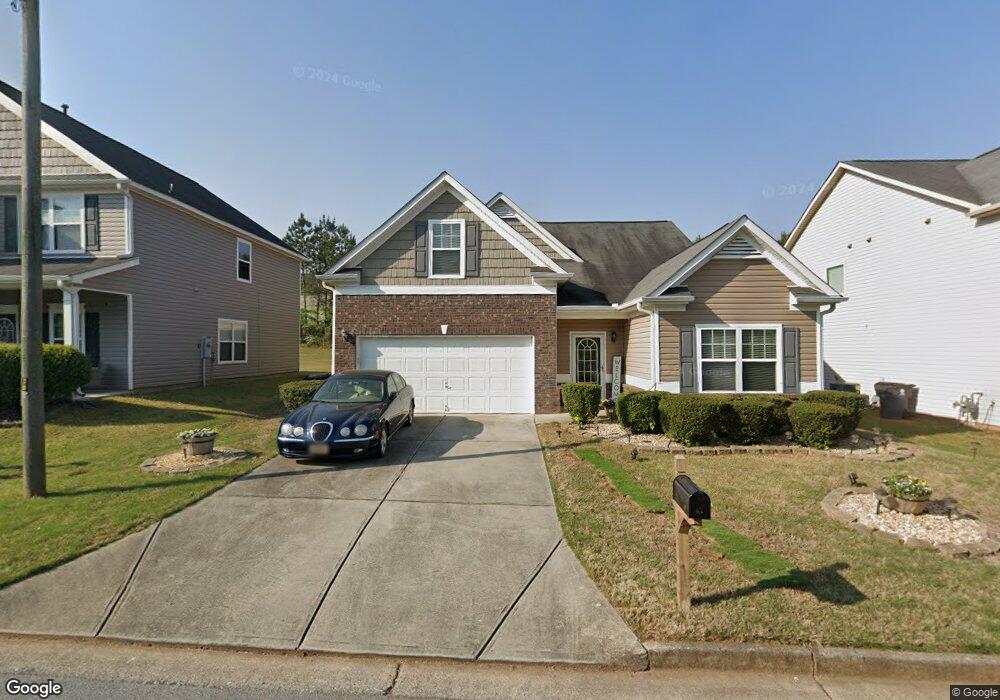
About This Home
This home is located at 67 Bollen Ln, Hiram, GA 30141 and is currently estimated at $337,598, approximately $169 per square foot. 67 Bollen Ln is a home with nearby schools including Hiram Elementary School, P. B. Ritch Middle School, and Hiram High School.
Ownership History
Date
Name
Owned For
Owner Type
Purchase Details
Closed on
Jan 16, 2018
Sold by
Wilson Kelly
Bought by
Wilson Neal and Wilson Kelly
Current Estimated Value
Purchase Details
Closed on
May 14, 2010
Sold by
Bhl Homebuilders Llc
Bought by
Draughn Kim N
Home Financials for this Owner
Home Financials are based on the most recent Mortgage that was taken out on this home.
Original Mortgage
$130,562
Interest Rate
5.5%
Mortgage Type
FHA
Create a Home Valuation Report for This Property
The Home Valuation Report is an in-depth analysis detailing your home's value as well as a comparison with similar homes in the area
Home Values in the Area
Average Home Value in this Area
Purchase History
| Date | Buyer | Sale Price | Title Company |
|---|---|---|---|
| Wilson Neal | -- | -- | |
| Cochran Alyssa Kalene | -- | -- | |
| Draughn Kim N | $132,421 | -- |
Source: Public Records
Mortgage History
| Date | Status | Borrower | Loan Amount |
|---|---|---|---|
| Previous Owner | Draughn Kim N | $130,562 |
Source: Public Records
Tax History Compared to Growth
Tax History
| Year | Tax Paid | Tax Assessment Tax Assessment Total Assessment is a certain percentage of the fair market value that is determined by local assessors to be the total taxable value of land and additions on the property. | Land | Improvement |
|---|---|---|---|---|
| 2024 | $3,181 | $131,112 | $16,000 | $115,112 |
| 2023 | $3,381 | $132,212 | $16,000 | $116,212 |
| 2022 | $3,024 | $117,872 | $12,000 | $105,872 |
| 2021 | $2,512 | $88,300 | $8,000 | $80,300 |
| 2020 | $2,335 | $80,464 | $8,000 | $72,464 |
| 2019 | $2,268 | $77,124 | $8,000 | $69,124 |
| 2018 | $2,047 | $69,812 | $8,000 | $61,812 |
| 2017 | $1,884 | $63,536 | $8,000 | $55,536 |
| 2016 | $1,792 | $61,136 | $8,000 | $53,136 |
| 2015 | $1,687 | $56,656 | $8,000 | $48,656 |
| 2014 | $1,192 | $39,624 | $8,000 | $31,624 |
| 2013 | -- | $30,560 | $8,000 | $22,560 |
Source: Public Records
Map
Nearby Homes
- 143 Birch St
- 98 Baywood Way
- 273 Baywood Crossing
- 322 Lanier Ct
- 79 Kennedy Ct
- 2393 Bill Carruth Pkwy
- 149 Willow Bend Rd
- 133 Willow Bend Rd
- 149 Willow Bend Dr
- 133 Willow Bend Dr
- 7606 Nebo Rd
- 7799 Nebo Rd
- 3124 Hiram Sudie Rd
- 261 Township Dr
- 14 Berkten Ct
- 74 Bonds Ct
- 8060 Nebo Rd
- 8060 Nevo Rd
- 153 Oak St
- 7012 Nebo Rd