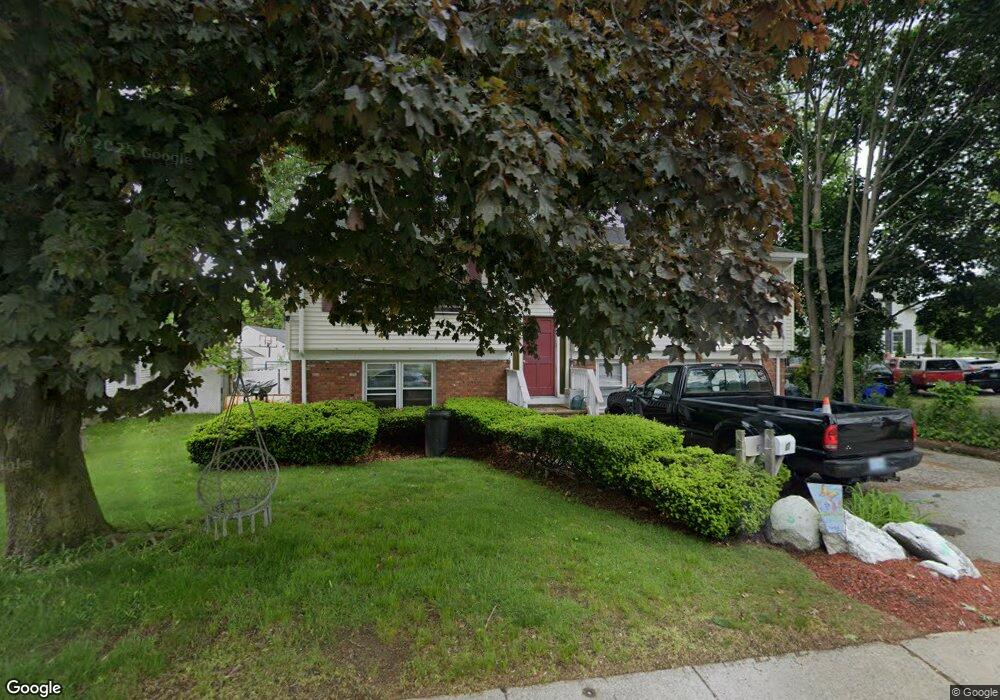
67 Borden Ave Johnston, RI 02919
Hartford Avenue NeighborhoodEstimated Value: $380,000 - $438,000
5
Beds
2
Baths
2,238
Sq Ft
$184/Sq Ft
Est. Value
About This Home
This home is located at 67 Borden Ave, Johnston, RI 02919 and is currently estimated at $411,623, approximately $183 per square foot. 67 Borden Ave is a home located in Providence County with nearby schools including Mazomanie Elementary School, Johnston Senior High School, and Achievement First Promesa.
Ownership History
Date
Name
Owned For
Owner Type
Purchase Details
Closed on
Aug 31, 2007
Sold by
Fochler James W and Kurbec Dorothy I
Bought by
Courtemanche Louis J and Courtemanche Deborah M
Current Estimated Value
Home Financials for this Owner
Home Financials are based on the most recent Mortgage that was taken out on this home.
Original Mortgage
$199,900
Outstanding Balance
$127,468
Interest Rate
6.71%
Mortgage Type
Purchase Money Mortgage
Estimated Equity
$284,155
Purchase Details
Closed on
May 22, 2007
Sold by
Gaglielmotti Janice M
Bought by
Fochler James W and Kurbiec Dorothy I
Home Financials for this Owner
Home Financials are based on the most recent Mortgage that was taken out on this home.
Original Mortgage
$188,100
Interest Rate
6.18%
Mortgage Type
Purchase Money Mortgage
Create a Home Valuation Report for This Property
The Home Valuation Report is an in-depth analysis detailing your home's value as well as a comparison with similar homes in the area
Home Values in the Area
Average Home Value in this Area
Purchase History
| Date | Buyer | Sale Price | Title Company |
|---|---|---|---|
| Courtemanche Louis J | $224,900 | -- | |
| Fochler James W | $209,000 | -- | |
| Courtemanche Louis J | $224,900 | -- | |
| Fochler James W | $209,000 | -- |
Source: Public Records
Mortgage History
| Date | Status | Borrower | Loan Amount |
|---|---|---|---|
| Open | Fochler James W | $199,900 | |
| Closed | Fochler James W | $199,900 | |
| Previous Owner | Fochler James W | $188,100 |
Source: Public Records
Tax History Compared to Growth
Tax History
| Year | Tax Paid | Tax Assessment Tax Assessment Total Assessment is a certain percentage of the fair market value that is determined by local assessors to be the total taxable value of land and additions on the property. | Land | Improvement |
|---|---|---|---|---|
| 2025 | $4,702 | $301,000 | $83,500 | $217,500 |
| 2024 | $4,605 | $301,000 | $83,500 | $217,500 |
| 2023 | $4,605 | $301,000 | $83,500 | $217,500 |
| 2022 | $4,383 | $188,600 | $61,800 | $126,800 |
| 2021 | $4,383 | $188,600 | $61,800 | $126,800 |
| 2018 | $4,434 | $161,300 | $46,000 | $115,300 |
| 2016 | $5,866 | $161,300 | $46,000 | $115,300 |
| 2015 | $4,511 | $155,600 | $46,500 | $109,100 |
| 2014 | $4,474 | $155,600 | $46,500 | $109,100 |
| 2013 | $4,474 | $155,600 | $46,500 | $109,100 |
Source: Public Records
Map
Nearby Homes
- 6 Flanders St
- 16 Homestead Ave
- 71 Waveland St
- 12 Oakland Ave
- 11 Traver Ave Unit 1
- 46 Auburn Ave
- 19 S Long St
- 35 Hedley Ave
- 0 Woodbine St
- 2 Fairmount Ave
- 10 S Long St
- 406 Killingly St
- 78 Stella St
- 50 Rosemont Ave
- 0 Jackson Ave
- 25 Devereux St Unit 205
- 44 Herschel St
- 17 Middleton St
- 91 Clifton St
- 336 Killingly St Unit D