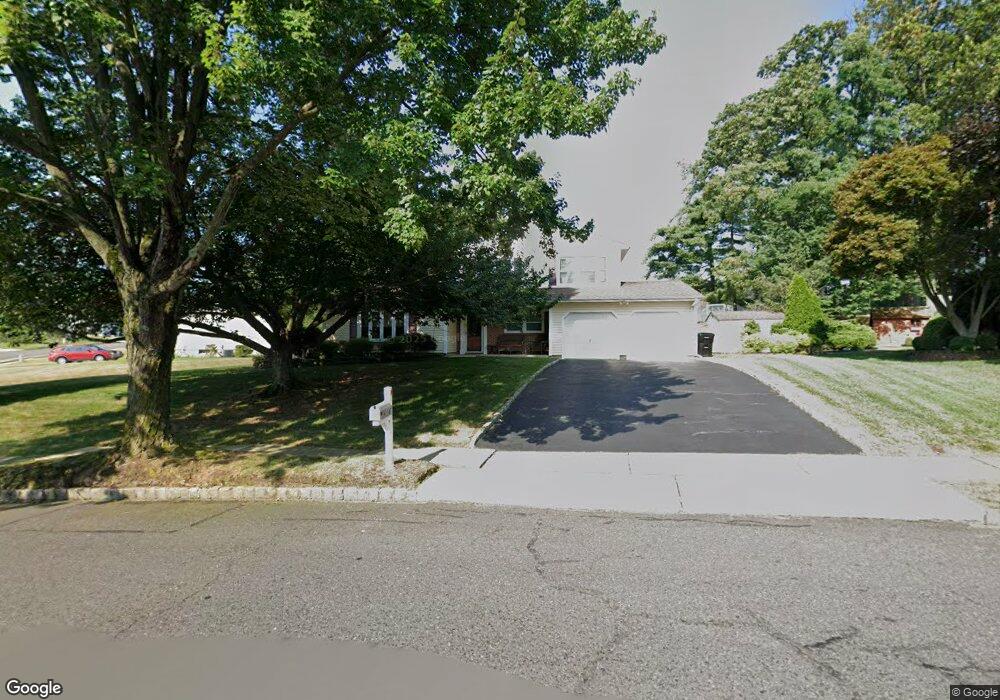
67 Buck Rd East Brunswick, NJ 08816
Estimated Value: $565,815 - $788,000
--
Bed
--
Bath
2,087
Sq Ft
$331/Sq Ft
Est. Value
About This Home
This home is located at 67 Buck Rd, East Brunswick, NJ 08816 and is currently estimated at $691,704, approximately $331 per square foot. 67 Buck Rd is a home located in Middlesex County with nearby schools including South River Primary School, South River Elementary School, and South River Middle School.
Ownership History
Date
Name
Owned For
Owner Type
Purchase Details
Closed on
May 6, 2005
Sold by
Taha Adlai
Bought by
Rojas Giovanni
Current Estimated Value
Home Financials for this Owner
Home Financials are based on the most recent Mortgage that was taken out on this home.
Original Mortgage
$81,200
Outstanding Balance
$42,175
Interest Rate
5.78%
Estimated Equity
$649,529
Purchase Details
Closed on
Apr 26, 2001
Sold by
Bottega Philip
Bought by
Taha Adlai and Taha Kerri
Home Financials for this Owner
Home Financials are based on the most recent Mortgage that was taken out on this home.
Original Mortgage
$258,400
Interest Rate
7.15%
Purchase Details
Closed on
Sep 24, 1996
Sold by
Weinberg Stanley
Bought by
Bottega Philip and Bottega Debra
Home Financials for this Owner
Home Financials are based on the most recent Mortgage that was taken out on this home.
Original Mortgage
$207,000
Interest Rate
8.06%
Create a Home Valuation Report for This Property
The Home Valuation Report is an in-depth analysis detailing your home's value as well as a comparison with similar homes in the area
Home Values in the Area
Average Home Value in this Area
Purchase History
| Date | Buyer | Sale Price | Title Company |
|---|---|---|---|
| Rojas Giovanni | $489,900 | -- | |
| Taha Adlai | $323,000 | -- | |
| Bottega Philip | $220,000 | -- |
Source: Public Records
Mortgage History
| Date | Status | Borrower | Loan Amount |
|---|---|---|---|
| Open | Rojas Giovanni | $81,200 | |
| Previous Owner | Taha Adlai | $258,400 | |
| Previous Owner | Bottega Philip | $207,000 |
Source: Public Records
Tax History Compared to Growth
Tax History
| Year | Tax Paid | Tax Assessment Tax Assessment Total Assessment is a certain percentage of the fair market value that is determined by local assessors to be the total taxable value of land and additions on the property. | Land | Improvement |
|---|---|---|---|---|
| 2025 | $13,730 | $112,600 | $33,300 | $79,300 |
| 2024 | $13,321 | $112,600 | $33,300 | $79,300 |
| 2023 | $13,321 | $112,600 | $33,300 | $79,300 |
| 2022 | $13,268 | $112,600 | $33,300 | $79,300 |
| 2021 | $12,889 | $112,600 | $33,300 | $79,300 |
| 2020 | $12,871 | $112,600 | $33,300 | $79,300 |
| 2019 | $12,734 | $112,600 | $33,300 | $79,300 |
| 2018 | $12,518 | $112,600 | $33,300 | $79,300 |
| 2017 | $12,316 | $112,600 | $33,300 | $79,300 |
| 2016 | $12,067 | $112,600 | $33,300 | $79,300 |
| 2015 | $11,784 | $112,600 | $33,300 | $79,300 |
| 2014 | $11,529 | $112,600 | $33,300 | $79,300 |
Source: Public Records
Map
Nearby Homes