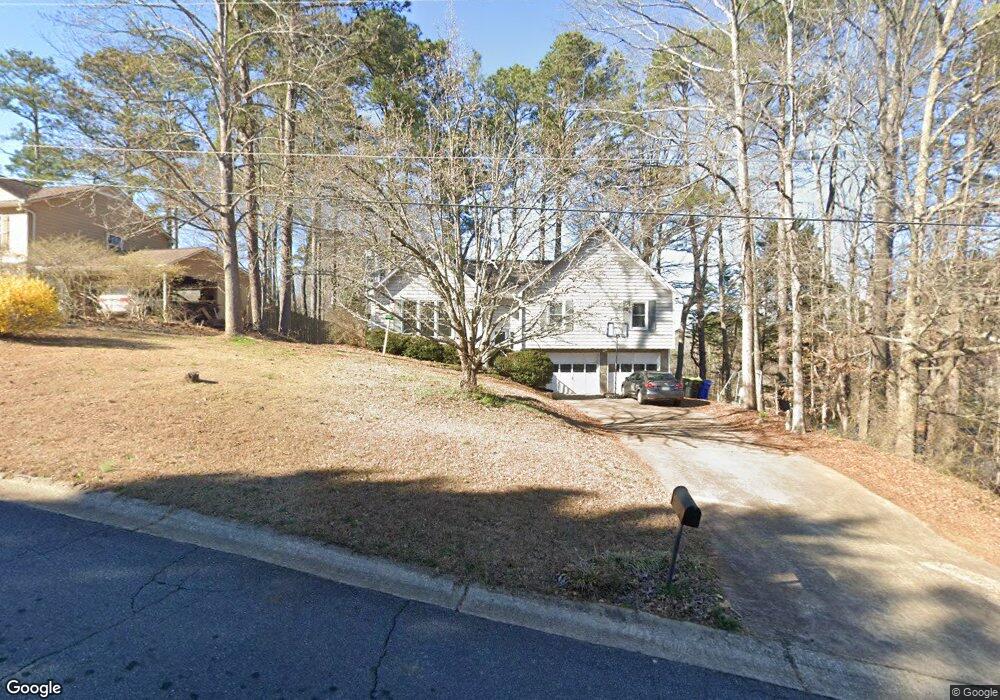
67 Carrington Way Hiram, GA 30141
East Paulding County NeighborhoodEstimated Value: $247,025 - $319,000
--
Bed
2
Baths
1,408
Sq Ft
$197/Sq Ft
Est. Value
About This Home
This home is located at 67 Carrington Way, Hiram, GA 30141 and is currently estimated at $278,006, approximately $197 per square foot. 67 Carrington Way is a home located in Paulding County with nearby schools including Mcgarity Elementary School, P. B. Ritch Middle School, and East Paulding High School.
Ownership History
Date
Name
Owned For
Owner Type
Purchase Details
Closed on
Jul 31, 2000
Sold by
Vickery Timothy E and Vickery Kimberly P
Bought by
Stiggard Maria K
Current Estimated Value
Home Financials for this Owner
Home Financials are based on the most recent Mortgage that was taken out on this home.
Original Mortgage
$92,050
Outstanding Balance
$32,197
Interest Rate
8.11%
Mortgage Type
New Conventional
Estimated Equity
$245,809
Create a Home Valuation Report for This Property
The Home Valuation Report is an in-depth analysis detailing your home's value as well as a comparison with similar homes in the area
Home Values in the Area
Average Home Value in this Area
Purchase History
| Date | Buyer | Sale Price | Title Company |
|---|---|---|---|
| Stiggard Maria K | $94,900 | -- |
Source: Public Records
Mortgage History
| Date | Status | Borrower | Loan Amount |
|---|---|---|---|
| Open | Stiggard Maria K | $92,050 |
Source: Public Records
Tax History Compared to Growth
Tax History
| Year | Tax Paid | Tax Assessment Tax Assessment Total Assessment is a certain percentage of the fair market value that is determined by local assessors to be the total taxable value of land and additions on the property. | Land | Improvement |
|---|---|---|---|---|
| 2024 | $2,427 | $100,800 | $12,000 | $88,800 |
| 2023 | $2,658 | $104,484 | $12,000 | $92,484 |
| 2022 | $2,465 | $96,420 | $12,000 | $84,420 |
| 2021 | $2,105 | $74,296 | $8,000 | $66,296 |
| 2020 | $1,777 | $61,680 | $8,000 | $53,680 |
| 2019 | $1,635 | $56,112 | $8,000 | $48,112 |
| 2018 | $1,396 | $48,204 | $8,000 | $40,204 |
| 2017 | $1,420 | $48,332 | $8,000 | $40,332 |
| 2016 | $1,382 | $47,556 | $8,000 | $39,556 |
| 2015 | $1,327 | $44,964 | $8,000 | $36,964 |
| 2014 | $1,225 | $40,656 | $8,000 | $32,656 |
| 2013 | -- | $32,120 | $8,000 | $24,120 |
Source: Public Records
Map
Nearby Homes
- 98 Pace Dr
- 1 Corley Cir
- 295 Hiram Acworth Hwy
- 150 Hiram Terrace
- 80 Indian Lake Dr
- 0 Old Mill Rd Unit 7632177
- 0 Old Mill Rd Unit 10569938
- 000 Us Highway 278
- 608 Barnfield Way
- 580 Barnfield Way
- 568 Barnfield Way
- Boylston Plan at Old Mill Preserve
- Kittridge Plan at Old Mill Preserve
- Pendula Plan at Old Mill Preserve
- Wellton Plan at Old Mill Preserve
- Anglewood Plan at Old Mill Preserve
- 209 Enterprise Path
- 507 Barnfield Way
- 517 Barnfield Way
- 0B Hiram Acworth Hwy
- 259 Pace Dr
- 49 Carrington Way
- 224 Pace Dr
- 28 Pinewood Ct
- 60 Carrington Way
- 281 Pace Dr
- 44 Carrington Way
- 256 Pace Dr
- 164 Dunaway Place
- 17 Carrington Way
- 114 Carrington Way
- 280 Pace Dr
- 293 Pace Dr
- 121 Carrington Way
- 188 Dunaway Place
- 20 Carrington Way
- 161 Pace Dr
- 138 Carrington Way
- 294 Pace Dr
- 194 Dunaway Place