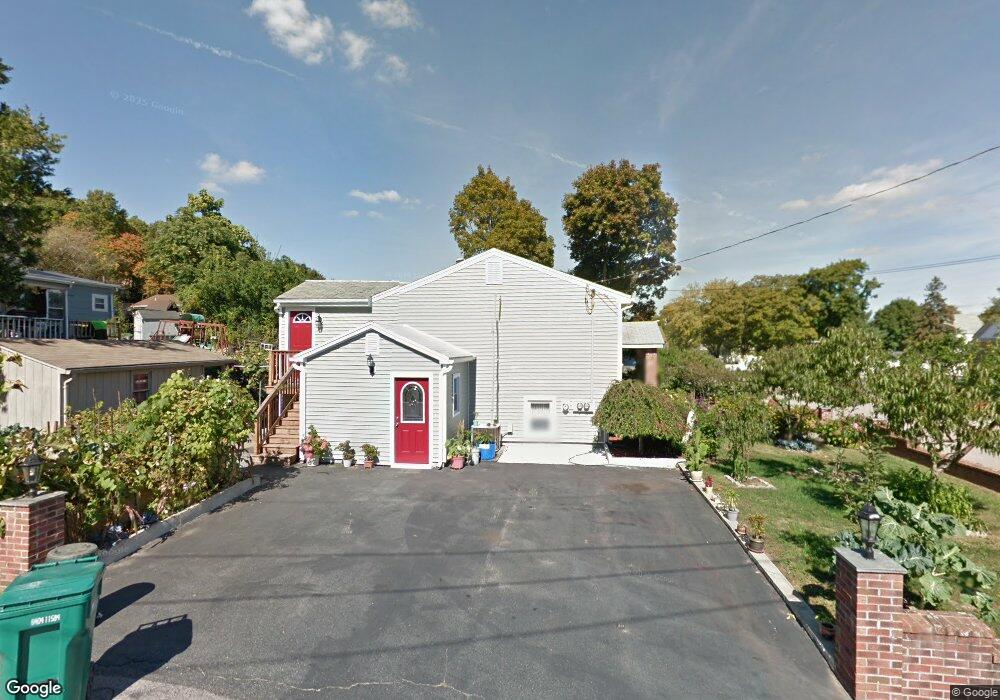
67 Cherry St Attleboro, MA 02703
Estimated Value: $449,000 - $603,000
4
Beds
2
Baths
2,200
Sq Ft
$244/Sq Ft
Est. Value
About This Home
This home is located at 67 Cherry St, Attleboro, MA 02703 and is currently estimated at $536,144, approximately $243 per square foot. 67 Cherry St is a home located in Bristol County with nearby schools including A. Irvin Studley Elementary School, Cyril K. Brennan Middle School, and Attleboro High School.
Ownership History
Date
Name
Owned For
Owner Type
Purchase Details
Closed on
Feb 1, 2005
Sold by
Almeida Odete M
Bought by
Freitas Jose C and Dacosta Maria C
Current Estimated Value
Home Financials for this Owner
Home Financials are based on the most recent Mortgage that was taken out on this home.
Original Mortgage
$332,500
Outstanding Balance
$168,114
Interest Rate
5.67%
Mortgage Type
Purchase Money Mortgage
Estimated Equity
$368,030
Create a Home Valuation Report for This Property
The Home Valuation Report is an in-depth analysis detailing your home's value as well as a comparison with similar homes in the area
Home Values in the Area
Average Home Value in this Area
Purchase History
| Date | Buyer | Sale Price | Title Company |
|---|---|---|---|
| Freitas Jose C | $350,000 | -- |
Source: Public Records
Mortgage History
| Date | Status | Borrower | Loan Amount |
|---|---|---|---|
| Open | Freitas Jose C | $332,500 |
Source: Public Records
Tax History
| Year | Tax Paid | Tax Assessment Tax Assessment Total Assessment is a certain percentage of the fair market value that is determined by local assessors to be the total taxable value of land and additions on the property. | Land | Improvement |
|---|---|---|---|---|
| 2025 | $5,910 | $470,900 | $127,200 | $343,700 |
| 2024 | $5,874 | $461,400 | $127,200 | $334,200 |
| 2023 | $5,497 | $401,500 | $115,600 | $285,900 |
| 2022 | $5,169 | $357,700 | $110,100 | $247,600 |
| 2021 | $4,769 | $322,200 | $105,800 | $216,400 |
| 2020 | $4,493 | $308,600 | $102,800 | $205,800 |
| 2019 | $4,237 | $299,200 | $100,800 | $198,400 |
| 2018 | $3,861 | $260,500 | $97,800 | $162,700 |
| 2017 | $3,799 | $261,100 | $97,800 | $163,300 |
| 2016 | $3,582 | $241,700 | $96,000 | $145,700 |
| 2015 | $3,533 | $240,200 | $96,000 | $144,200 |
| 2014 | $3,352 | $225,700 | $91,400 | $134,300 |
Source: Public Records
Map
Nearby Homes
- 19 Beech St
- 138 Fisher St Unit A
- 138 Fisher St Unit B
- 17 Crawford Ave
- 17 Jewel Ave
- 249 County St
- 0 Joseph St Unit 73469304
- 0 Tulip Unit 73482326
- 0 Tulip Unit 73482330
- 49 Dennis St
- 101 South Ave Unit 1004
- 660 Thacher St Unit 402
- 6 Dailey St Unit J
- 147 County St
- 75 Dennis St Unit 3
- 21 4th St
- 124 Tiffany St
- 720 Thacher St
- 18-20 Jefferson St
- 43 Maple St
Your Personal Tour Guide
Ask me questions while you tour the home.