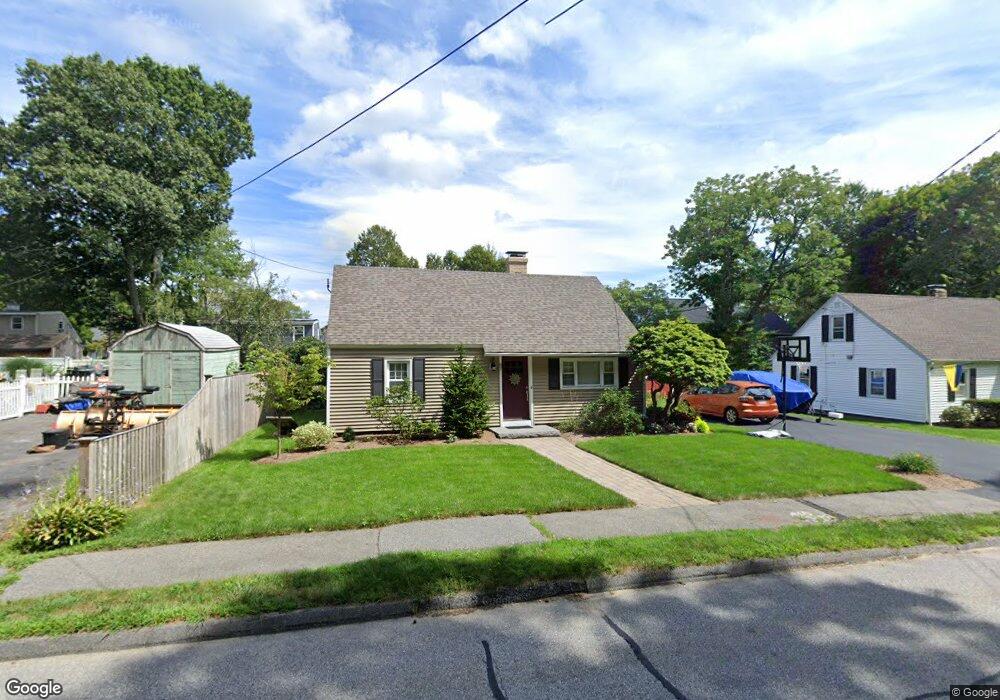
67 Crescent St Shrewsbury, MA 01545
Estimated Value: $450,000 - $510,669
4
Beds
1
Bath
1,185
Sq Ft
$405/Sq Ft
Est. Value
About This Home
This home is located at 67 Crescent St, Shrewsbury, MA 01545 and is currently estimated at $480,417, approximately $405 per square foot. 67 Crescent St is a home located in Worcester County with nearby schools including Sherwood Middle School, Floral Street School, and Oak Middle School.
Ownership History
Date
Name
Owned For
Owner Type
Purchase Details
Closed on
Nov 24, 2009
Sold by
Flynn T T and Flynn F
Bought by
Salvi John H and Mcdonald Brenda K
Current Estimated Value
Home Financials for this Owner
Home Financials are based on the most recent Mortgage that was taken out on this home.
Original Mortgage
$210,000
Outstanding Balance
$136,693
Interest Rate
4.86%
Mortgage Type
Purchase Money Mortgage
Estimated Equity
$343,724
Create a Home Valuation Report for This Property
The Home Valuation Report is an in-depth analysis detailing your home's value as well as a comparison with similar homes in the area
Home Values in the Area
Average Home Value in this Area
Purchase History
| Date | Buyer | Sale Price | Title Company |
|---|---|---|---|
| Salvi John H | $225,000 | -- | |
| Salvi John H | $225,000 | -- | |
| Salvi John H | $225,000 | -- |
Source: Public Records
Mortgage History
| Date | Status | Borrower | Loan Amount |
|---|---|---|---|
| Open | Salvi John H | $210,000 | |
| Closed | Salvi John H | $210,000 | |
| Previous Owner | Salvi John H | $50,000 | |
| Previous Owner | Salvi John H | $80,000 |
Source: Public Records
Tax History Compared to Growth
Tax History
| Year | Tax Paid | Tax Assessment Tax Assessment Total Assessment is a certain percentage of the fair market value that is determined by local assessors to be the total taxable value of land and additions on the property. | Land | Improvement |
|---|---|---|---|---|
| 2025 | $51 | $425,200 | $236,300 | $188,900 |
| 2024 | $4,661 | $376,500 | $225,000 | $151,500 |
| 2023 | $4,587 | $349,600 | $225,000 | $124,600 |
| 2022 | $4,953 | $351,000 | $225,000 | $126,000 |
| 2021 | $3,825 | $290,000 | $180,000 | $110,000 |
| 2020 | $3,616 | $290,000 | $180,000 | $110,000 |
| 2019 | $3,411 | $271,400 | $166,100 | $105,300 |
| 2018 | $3,226 | $254,800 | $157,500 | $97,300 |
| 2017 | $3,088 | $240,700 | $140,600 | $100,100 |
| 2016 | $3,037 | $233,600 | $131,700 | $101,900 |
| 2015 | $3,024 | $229,100 | $130,000 | $99,100 |
Source: Public Records
Map
Nearby Homes
- 33 Shady Lane Ave
- 21 Fiske St
- 25 Harriet Ave
- 15 Conifer Cir Unit 31
- 5 Conifer Cir Unit 28
- 3 Conifer Cir Unit 29
- 9 Heritage St
- 129 A-B Maple Ave
- 43 Harriet Ave
- 31 Oak St
- 102 Harrington Farms Way
- 13 Kenilworth Rd
- 60 Harrington Farms Way Unit 60
- 9 Arnold Rd
- 29 Elma Cir
- 20 Williamsburg Ct Unit 21
- 114 Grafton St
- 18 Eastwood Rd
- 26 Williamsburg Ct Unit 22
- 46-50 Wesleyan St
- 69 Crescent St
- 65 Crescent St
- 9 Shady Lane Ave
- 11 Shady Lane Ave
- 7 Shady Lane Ave
- 71 Crescent St
- 63 Crescent St
- 19 Shady Lane Ave
- 5 Shady Lane Ave
- 21 Shady Lane Ave
- 61 Crescent St
- 16 Shady Lane Ave
- 1 -3 Bellridge Dr
- 13 Bellridge Dr
- 83 Crescent St
- 83 Crescent St Unit 83 Crescent
- 20 Shady Lane Ave
- 52 Spruce St
- 23 Shady Lane Ave
- 11 Bellridge Dr