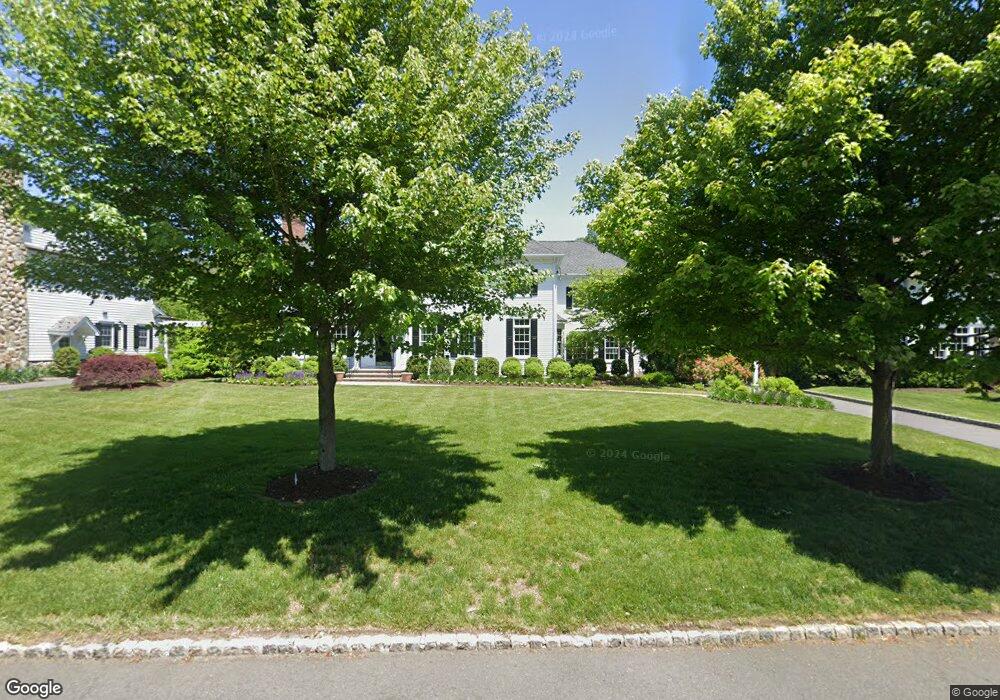
67 Dale Dr Chatham, NJ 07928
Estimated Value: $3,370,000 - $3,779,000
--
Bed
--
Bath
5,764
Sq Ft
$622/Sq Ft
Est. Value
About This Home
This home is located at 67 Dale Dr, Chatham, NJ 07928 and is currently estimated at $3,585,901, approximately $622 per square foot. 67 Dale Dr is a home located in Morris County with nearby schools including Chatham High School, St. Patrick School, and ECLC of New Jersey.
Ownership History
Date
Name
Owned For
Owner Type
Purchase Details
Closed on
Apr 28, 2010
Sold by
S Demarzo & Sons Llc
Bought by
Tighe James L and Tighe Kimberley Ann
Current Estimated Value
Home Financials for this Owner
Home Financials are based on the most recent Mortgage that was taken out on this home.
Original Mortgage
$1,400,000
Outstanding Balance
$958,799
Interest Rate
5.5%
Mortgage Type
New Conventional
Estimated Equity
$2,627,102
Purchase Details
Closed on
Oct 27, 2009
Sold by
Jerome Rosemary B
Bought by
S Demarzo & Sons Llc
Create a Home Valuation Report for This Property
The Home Valuation Report is an in-depth analysis detailing your home's value as well as a comparison with similar homes in the area
Home Values in the Area
Average Home Value in this Area
Purchase History
| Date | Buyer | Sale Price | Title Company |
|---|---|---|---|
| Tighe James L | $2,300,000 | None Available | |
| S Demarzo & Sons Llc | $900,000 | None Available | |
| Jerome Rosemary B | -- | None Available | |
| Jerome Rosemary B | -- | None Available |
Source: Public Records
Mortgage History
| Date | Status | Borrower | Loan Amount |
|---|---|---|---|
| Open | Tighe James L | $1,400,000 |
Source: Public Records
Tax History Compared to Growth
Tax History
| Year | Tax Paid | Tax Assessment Tax Assessment Total Assessment is a certain percentage of the fair market value that is determined by local assessors to be the total taxable value of land and additions on the property. | Land | Improvement |
|---|---|---|---|---|
| 2025 | $42,785 | $2,151,100 | $712,900 | $1,438,200 |
| 2024 | $42,076 | $2,151,100 | $712,900 | $1,438,200 |
| 2023 | $42,076 | $2,151,100 | $712,900 | $1,438,200 |
| 2022 | $41,244 | $2,135,900 | $712,900 | $1,423,000 |
| 2021 | $41,244 | $2,135,900 | $712,900 | $1,423,000 |
| 2020 | $40,433 | $2,135,900 | $712,900 | $1,423,000 |
| 2019 | $39,600 | $2,135,900 | $712,900 | $1,423,000 |
| 2018 | $39,151 | $2,135,900 | $712,900 | $1,423,000 |
| 2017 | $38,169 | $2,135,900 | $712,900 | $1,423,000 |
| 2016 | $37,570 | $2,135,900 | $712,900 | $1,423,000 |
| 2015 | $37,421 | $2,135,900 | $712,900 | $1,423,000 |
| 2014 | $37,122 | $2,135,900 | $712,900 | $1,423,000 |
Source: Public Records
Map
Nearby Homes