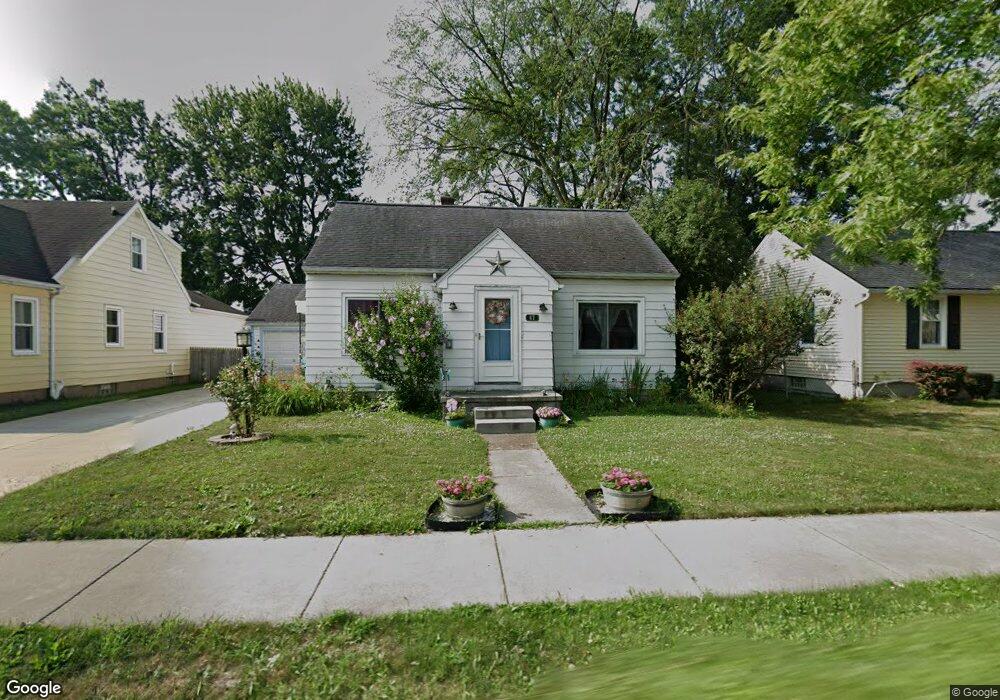
67 Delton St Tonawanda, NY 14150
Estimated Value: $224,000 - $262,000
3
Beds
2
Baths
1,440
Sq Ft
$171/Sq Ft
Est. Value
About This Home
This home is located at 67 Delton St, Tonawanda, NY 14150 and is currently estimated at $246,870, approximately $171 per square foot. 67 Delton St is a home located in Erie County with nearby schools including Mullen Elementary School, Tonawanda Elementary School, and Tonawanda Middle High School.
Ownership History
Date
Name
Owned For
Owner Type
Purchase Details
Closed on
Apr 13, 2017
Sold by
Bailey George H
Bought by
Bailey George H and Bailey Julie A
Current Estimated Value
Purchase Details
Closed on
Jun 13, 2008
Sold by
Young Jennifer M and Haines Jennifer M
Bought by
Bailey George H
Home Financials for this Owner
Home Financials are based on the most recent Mortgage that was taken out on this home.
Original Mortgage
$83,600
Outstanding Balance
$53,783
Interest Rate
6.1%
Mortgage Type
Purchase Money Mortgage
Estimated Equity
$193,087
Create a Home Valuation Report for This Property
The Home Valuation Report is an in-depth analysis detailing your home's value as well as a comparison with similar homes in the area
Home Values in the Area
Average Home Value in this Area
Purchase History
| Date | Buyer | Sale Price | Title Company |
|---|---|---|---|
| Bailey George H | -- | None Available | |
| Bailey George H | $90,600 | None Available |
Source: Public Records
Mortgage History
| Date | Status | Borrower | Loan Amount |
|---|---|---|---|
| Open | Bailey George H | $83,600 |
Source: Public Records
Tax History Compared to Growth
Tax History
| Year | Tax Paid | Tax Assessment Tax Assessment Total Assessment is a certain percentage of the fair market value that is determined by local assessors to be the total taxable value of land and additions on the property. | Land | Improvement |
|---|---|---|---|---|
| 2024 | $2,720 | $180,000 | $19,900 | $160,100 |
| 2023 | $2,197 | $180,000 | $19,900 | $160,100 |
| 2022 | $2,424 | $109,000 | $12,500 | $96,500 |
| 2021 | $2,415 | $109,000 | $12,500 | $96,500 |
| 2020 | $1,923 | $109,000 | $12,500 | $96,500 |
| 2019 | $3,106 | $109,000 | $12,500 | $96,500 |
| 2018 | $1,841 | $109,000 | $12,500 | $96,500 |
| 2017 | $539 | $89,000 | $10,400 | $78,600 |
| 2016 | $1,569 | $89,000 | $10,400 | $78,600 |
| 2015 | -- | $89,000 | $10,400 | $78,600 |
| 2014 | -- | $89,000 | $10,400 | $78,600 |
Source: Public Records
Map
Nearby Homes