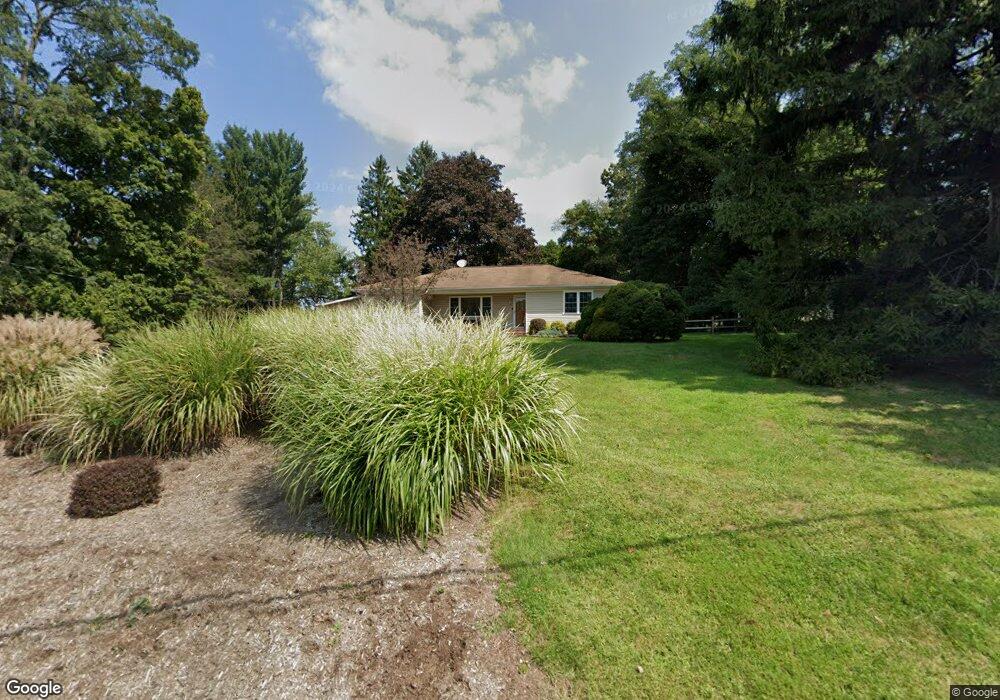
67 Dewey Ave High Bridge, NJ 08829
Estimated Value: $403,000 - $518,000
Studio
--
Bath
1,197
Sq Ft
$375/Sq Ft
Est. Value
About This Home
This home is located at 67 Dewey Ave, High Bridge, NJ 08829 and is currently estimated at $448,442, approximately $374 per square foot. 67 Dewey Ave is a home located in Hunterdon County with nearby schools including High Bridge Elementary School, High Bridge Middle School, and Voorhees High School.
Ownership History
Date
Name
Owned For
Owner Type
Purchase Details
Closed on
Apr 9, 2015
Sold by
Radomski Ann B and Rinaldi Ann B
Bought by
Radomski Ann B and Radomski Glen W
Current Estimated Value
Purchase Details
Closed on
Jan 16, 2001
Sold by
Evans Eborah Y
Bought by
Rinaldi Ann B
Home Financials for this Owner
Home Financials are based on the most recent Mortgage that was taken out on this home.
Original Mortgage
$145,000
Outstanding Balance
$53,422
Interest Rate
7.52%
Estimated Equity
$395,020
Purchase Details
Closed on
Jul 29, 1999
Sold by
Cooper David S
Bought by
Evans Deborah Y
Home Financials for this Owner
Home Financials are based on the most recent Mortgage that was taken out on this home.
Original Mortgage
$100,000
Interest Rate
7.54%
Purchase Details
Closed on
Dec 7, 1990
Sold by
Regan Martha A
Bought by
Cooper David S and Cooper Sharon A
Create a Home Valuation Report for This Property
The Home Valuation Report is an in-depth analysis detailing your home's value as well as a comparison with similar homes in the area
Home Values in the Area
Average Home Value in this Area
Purchase History
| Date | Buyer | Sale Price | Title Company |
|---|---|---|---|
| Radomski Ann B | -- | Commonwealth Land Title Ins | |
| Rinaldi Ann B | $245,000 | -- | |
| Evans Deborah Y | $219,000 | -- | |
| Cooper David S | $153,000 | -- |
Source: Public Records
Mortgage History
| Date | Status | Borrower | Loan Amount |
|---|---|---|---|
| Open | Rinaldi Ann B | $145,000 | |
| Previous Owner | Evans Deborah Y | $100,000 |
Source: Public Records
Tax History
| Year | Tax Paid | Tax Assessment Tax Assessment Total Assessment is a certain percentage of the fair market value that is determined by local assessors to be the total taxable value of land and additions on the property. | Land | Improvement |
|---|---|---|---|---|
| 2025 | $11,339 | $362,700 | $200,000 | $162,700 |
| 2024 | $11,229 | $347,400 | $151,200 | $196,200 |
Source: Public Records
Map
Nearby Homes
Your Personal Tour Guide
Ask me questions while you tour the home.