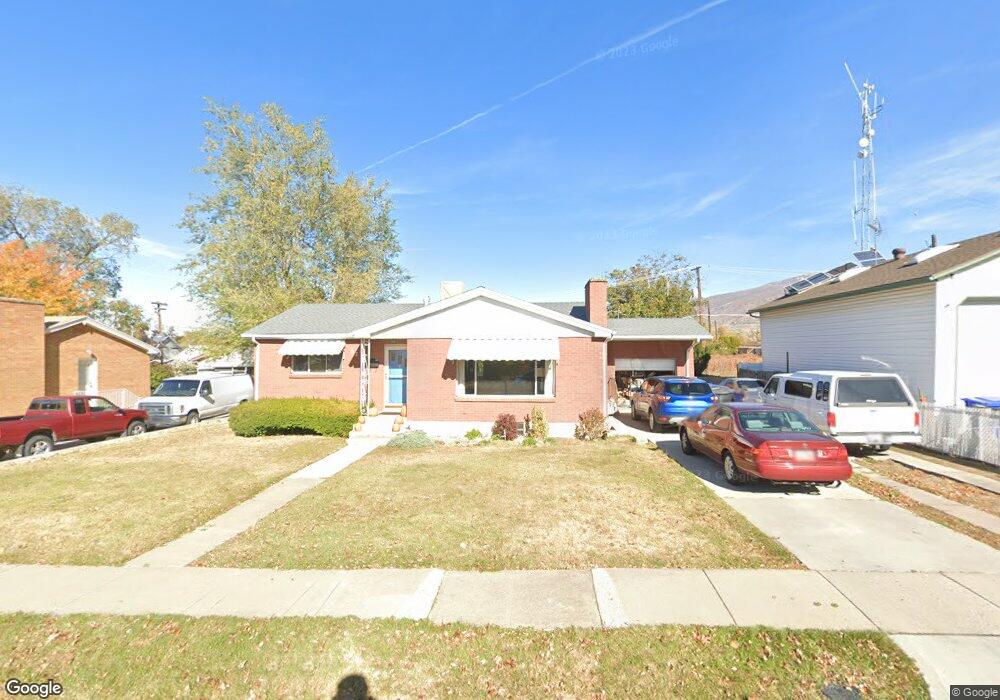
67 E 1100 S Bountiful, UT 84010
Estimated Value: $481,000 - $513,000
3
Beds
2
Baths
2,094
Sq Ft
$238/Sq Ft
Est. Value
About This Home
This home is located at 67 E 1100 S, Bountiful, UT 84010 and is currently estimated at $498,411, approximately $238 per square foot. 67 E 1100 S is a home located in Davis County with nearby schools including Bountiful Elementary School, Millcreek Junior High School, and Bountiful High School.
Ownership History
Date
Name
Owned For
Owner Type
Purchase Details
Closed on
Feb 7, 2013
Sold by
Henrikson Lee and Henrikson Ruth
Bought by
Henrikson Ruth and Henrikson Lee
Current Estimated Value
Home Financials for this Owner
Home Financials are based on the most recent Mortgage that was taken out on this home.
Original Mortgage
$164,835
Outstanding Balance
$115,941
Interest Rate
3.62%
Mortgage Type
FHA
Estimated Equity
$382,470
Purchase Details
Closed on
Jul 13, 2004
Sold by
Hart Rose Marie
Bought by
Henrikson Lee and Henrikson Ruth
Home Financials for this Owner
Home Financials are based on the most recent Mortgage that was taken out on this home.
Original Mortgage
$127,920
Interest Rate
5.95%
Mortgage Type
Purchase Money Mortgage
Purchase Details
Closed on
Nov 30, 2000
Sold by
Hart Rose G and Hart Rose Marie
Bought by
Hart Rose Marie
Create a Home Valuation Report for This Property
The Home Valuation Report is an in-depth analysis detailing your home's value as well as a comparison with similar homes in the area
Purchase History
| Date | Buyer | Sale Price | Title Company |
|---|---|---|---|
| Henrikson Ruth | -- | Us Title Company Of | |
| Henrikson Lee | -- | Backman Stewart Title Servic | |
| Hart Rose Marie | -- | -- | |
| Hart Rose G | -- | -- |
Source: Public Records
Mortgage History
| Date | Status | Borrower | Loan Amount |
|---|---|---|---|
| Open | Henrikson Ruth | $164,835 | |
| Closed | Henrikson Lee | $127,920 | |
| Closed | Henrikson Lee | $31,980 |
Source: Public Records
Tax History
| Year | Tax Paid | Tax Assessment Tax Assessment Total Assessment is a certain percentage of the fair market value that is determined by local assessors to be the total taxable value of land and additions on the property. | Land | Improvement |
|---|---|---|---|---|
| 2025 | $3,118 | $247,500 | $130,105 | $117,395 |
| 2024 | $2,830 | $239,250 | $117,088 | $122,162 |
| 2023 | $2,735 | $418,000 | $215,716 | $202,284 |
| 2022 | $2,794 | $227,700 | $117,873 | $109,827 |
| 2021 | $2,304 | $316,000 | $154,251 | $161,749 |
| 2020 | $2,224 | $281,000 | $131,760 | $149,240 |
| 2019 | $2,150 | $276,000 | $139,119 | $136,881 |
| 2018 | $1,957 | $253,000 | $136,369 | $116,631 |
| 2016 | $1,681 | $116,380 | $56,584 | $59,796 |
| 2015 | $1,657 | $108,185 | $56,584 | $51,601 |
| 2014 | $1,707 | $115,474 | $56,584 | $58,890 |
| 2013 | -- | $103,399 | $43,945 | $59,454 |
Source: Public Records
Map
Nearby Homes
- 285 E 1100 S
- 545 S 100 E
- 650 S Main St Unit 6206
- 650 S Main St Unit 4104
- 650 S Main St Unit 9106
- 141 E 1650 S
- 323 Peach Ln
- 275 E Peach Ln S
- 1350 S 200 W
- 380 E 1500 S
- 1314 S 200 W Unit 19
- 288 E 1650 S
- 34 W 400 S
- 520 S Orchard Dr Unit 17
- 32 W 400 S
- 357 S 100 E
- 255 E 400 S
- 456 E 500 S
- 1820 S 50 W
- 1016 S 400 W
Your Personal Tour Guide
Ask me questions while you tour the home.