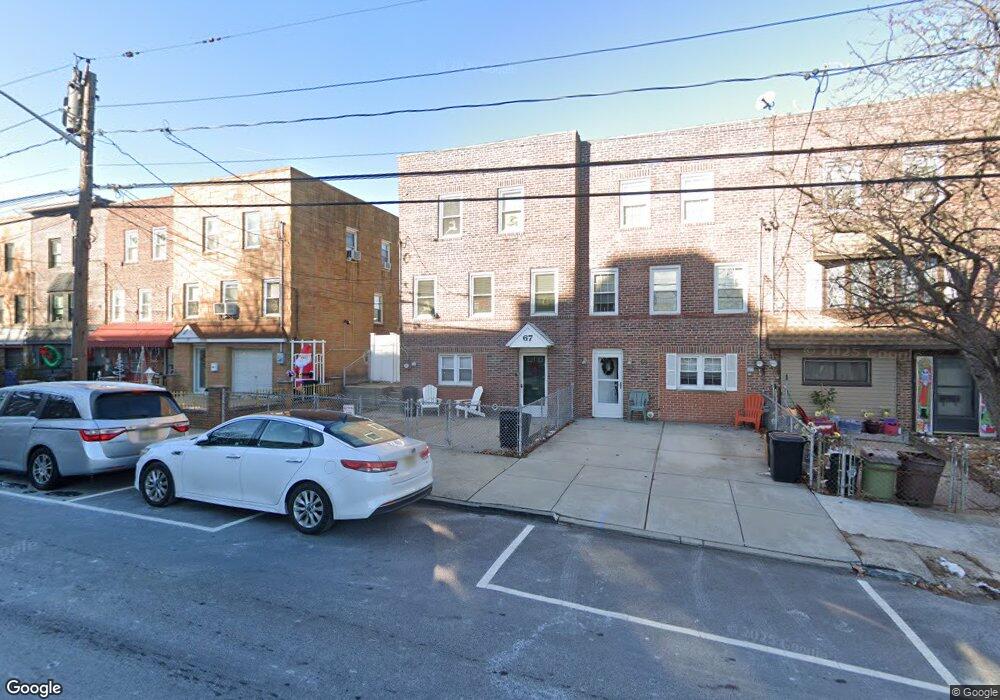
67 E 3rd St Bayonne, NJ 07002
Constable Hook NeighborhoodEstimated Value: $551,000 - $629,000
3
Beds
2
Baths
1,800
Sq Ft
$324/Sq Ft
Est. Value
About This Home
This home is located at 67 E 3rd St, Bayonne, NJ 07002 and is currently estimated at $583,104, approximately $323 per square foot. 67 E 3rd St is a home located in Hudson County with nearby schools including Bayonne High School, All Saints Catholic Academy, and Beacon Christian Academy.
Ownership History
Date
Name
Owned For
Owner Type
Purchase Details
Closed on
Sep 18, 2012
Sold by
Bcb Community Bank
Bought by
Corrigan Scott and Corrigan Fraimar
Current Estimated Value
Home Financials for this Owner
Home Financials are based on the most recent Mortgage that was taken out on this home.
Original Mortgage
$216,015
Outstanding Balance
$151,571
Interest Rate
3.87%
Mortgage Type
FHA
Estimated Equity
$431,533
Purchase Details
Closed on
Dec 14, 2010
Sold by
Moade Jeffrey and Moade Sheila
Bought by
Bcb Community Bank
Purchase Details
Closed on
Sep 27, 2007
Sold by
Chizmar Joseph F and Chizmar Catherine
Bought by
Moade Sheila and Moade Jeffrey
Create a Home Valuation Report for This Property
The Home Valuation Report is an in-depth analysis detailing your home's value as well as a comparison with similar homes in the area
Home Values in the Area
Average Home Value in this Area
Purchase History
| Date | Buyer | Sale Price | Title Company |
|---|---|---|---|
| Corrigan Scott | $220,000 | None Available | |
| Bcb Community Bank | -- | -- | |
| Moade Sheila | $379,900 | Stewart Title Guaranty Co |
Source: Public Records
Mortgage History
| Date | Status | Borrower | Loan Amount |
|---|---|---|---|
| Open | Corrigan Scott | $216,015 |
Source: Public Records
Tax History
| Year | Tax Paid | Tax Assessment Tax Assessment Total Assessment is a certain percentage of the fair market value that is determined by local assessors to be the total taxable value of land and additions on the property. | Land | Improvement |
|---|---|---|---|---|
| 2025 | $9,618 | $344,000 | $181,500 | $162,500 |
| 2024 | $9,230 | $344,000 | $181,500 | $162,500 |
| 2023 | $9,230 | $344,000 | $181,500 | $162,500 |
| 2022 | $9,058 | $344,000 | $181,500 | $162,500 |
| 2021 | $8,985 | $344,000 | $181,500 | $162,500 |
| 2020 | $8,827 | $344,000 | $181,500 | $162,500 |
| 2019 | $8,621 | $99,900 | $46,600 | $53,300 |
| 2018 | $8,450 | $99,900 | $46,600 | $53,300 |
| 2017 | $8,231 | $99,900 | $46,600 | $53,300 |
| 2016 | $7,927 | $99,900 | $46,600 | $53,300 |
| 2015 | $7,666 | $99,900 | $46,600 | $53,300 |
| 2014 | $7,438 | $99,900 | $46,600 | $53,300 |
Source: Public Records
Map
Nearby Homes
Your Personal Tour Guide
Ask me questions while you tour the home.