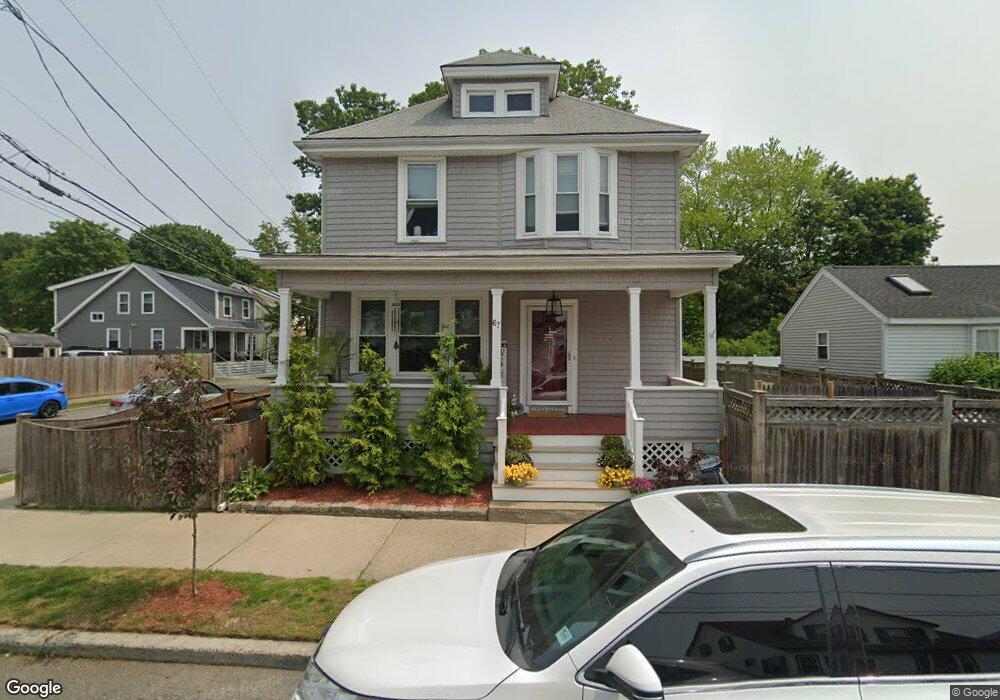
67 E Park Ave Lynn, MA 01902
Eastern Avenue NeighborhoodEstimated Value: $569,885 - $627,000
3
Beds
2
Baths
1,433
Sq Ft
$421/Sq Ft
Est. Value
About This Home
This home is located at 67 E Park Ave, Lynn, MA 01902 and is currently estimated at $603,471, approximately $421 per square foot. 67 E Park Ave is a home located in Essex County with nearby schools including Hood Elementary School, William R. Fallon School, and Marshall Middle School.
Ownership History
Date
Name
Owned For
Owner Type
Purchase Details
Closed on
Sep 18, 2015
Sold by
Kmiec Michael T and Kmiec Ashley T
Bought by
Affonco Jesse and Affonco Ashley
Current Estimated Value
Home Financials for this Owner
Home Financials are based on the most recent Mortgage that was taken out on this home.
Original Mortgage
$305,735
Outstanding Balance
$239,059
Interest Rate
3.94%
Mortgage Type
VA
Estimated Equity
$364,412
Purchase Details
Closed on
Dec 10, 2004
Sold by
A James Lynch Inc
Bought by
Kmiec Michael T and Seed Ashley T
Purchase Details
Closed on
Jan 6, 2004
Sold by
Osborne George
Bought by
A James Lynch Inc
Create a Home Valuation Report for This Property
The Home Valuation Report is an in-depth analysis detailing your home's value as well as a comparison with similar homes in the area
Home Values in the Area
Average Home Value in this Area
Purchase History
| Date | Buyer | Sale Price | Title Company |
|---|---|---|---|
| Affonco Jesse | $300,000 | -- | |
| Kmiec Michael T | $308,000 | -- | |
| Kmiec Michael T | $308,000 | -- | |
| A James Lynch Inc | $195,000 | -- | |
| A James Lynch Inc | $195,000 | -- |
Source: Public Records
Mortgage History
| Date | Status | Borrower | Loan Amount |
|---|---|---|---|
| Open | Affonco Jesse | $305,735 | |
| Closed | Affonco Jesse | $305,735 | |
| Previous Owner | A James Lynch Inc | $225,240 | |
| Previous Owner | A James Lynch Inc | $235,000 |
Source: Public Records
Tax History
| Year | Tax Paid | Tax Assessment Tax Assessment Total Assessment is a certain percentage of the fair market value that is determined by local assessors to be the total taxable value of land and additions on the property. | Land | Improvement |
|---|---|---|---|---|
| 2025 | $5,738 | $553,900 | $194,600 | $359,300 |
| 2024 | $5,381 | $511,000 | $183,000 | $328,000 |
| 2023 | $4,974 | $446,100 | $180,500 | $265,600 |
| 2022 | $4,906 | $394,700 | $145,300 | $249,400 |
| 2021 | $4,512 | $346,300 | $122,800 | $223,500 |
| 2020 | $4,445 | $331,700 | $119,900 | $211,800 |
| 2019 | $4,203 | $293,900 | $112,100 | $181,800 |
| 2018 | $4,253 | $280,700 | $120,800 | $159,900 |
| 2017 | $4,036 | $258,700 | $99,600 | $159,100 |
| 2016 | $3,974 | $245,600 | $100,000 | $145,600 |
| 2015 | $3,807 | $227,300 | $100,000 | $127,300 |
Source: Public Records
Map
Nearby Homes
- 21 E Park Ave
- 91 Oakwood Ave
- 40 Archer St
- 16 Isabella St
- 16 Clinton St
- 50 Webster St
- 431-433 Chatham St
- 60 Roy St
- 129 Marianna St
- 6A Goodridge St
- 30 Clifton Ave
- 40 Buena Vista St
- 59 Essex St Unit 59B
- 27-29 Graves Ave
- 17 Marianna St
- 19 Gage St
- 1 Clough St
- 106 Williams Ave
- 129 Williams Ave
- 406 Chestnut St
Your Personal Tour Guide
Ask me questions while you tour the home.