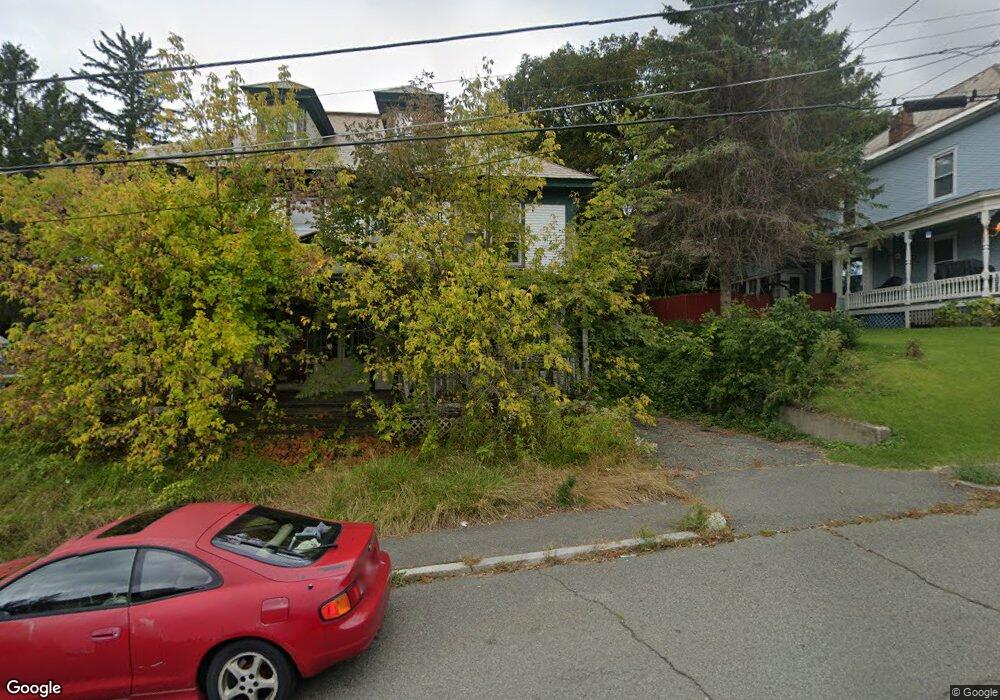
67 E Quincy St Unit 69 North Adams, MA 01247
Estimated Value: $128,000 - $255,000
8
Beds
4
Baths
4,171
Sq Ft
$45/Sq Ft
Est. Value
About This Home
This home is located at 67 E Quincy St Unit 69, North Adams, MA 01247 and is currently estimated at $188,064, approximately $45 per square foot. 67 E Quincy St Unit 69 is a home located in Berkshire County with nearby schools including Colegrove Park Elementary School and Drury High School.
Ownership History
Date
Name
Owned For
Owner Type
Purchase Details
Closed on
Jun 1, 2007
Sold by
Briggs Charles L and Briggs Michele C
Bought by
Broemmel Patrick J and Cassidy Patrick J
Current Estimated Value
Home Financials for this Owner
Home Financials are based on the most recent Mortgage that was taken out on this home.
Original Mortgage
$116,000
Outstanding Balance
$71,172
Interest Rate
6.24%
Mortgage Type
Purchase Money Mortgage
Estimated Equity
$116,892
Purchase Details
Closed on
Jul 19, 1995
Sold by
Murray Jeannette F and Horrigan Suzanne M
Bought by
Briggs Charles L
Home Financials for this Owner
Home Financials are based on the most recent Mortgage that was taken out on this home.
Original Mortgage
$48,800
Interest Rate
7.49%
Mortgage Type
Purchase Money Mortgage
Create a Home Valuation Report for This Property
The Home Valuation Report is an in-depth analysis detailing your home's value as well as a comparison with similar homes in the area
Home Values in the Area
Average Home Value in this Area
Purchase History
| Date | Buyer | Sale Price | Title Company |
|---|---|---|---|
| Broemmel Patrick J | $145,000 | -- | |
| Broemmel Patrick J | $145,000 | -- | |
| Briggs Charles L | $61,000 | -- | |
| Briggs Charles L | $61,000 | -- |
Source: Public Records
Mortgage History
| Date | Status | Borrower | Loan Amount |
|---|---|---|---|
| Open | Broemmel Patrick J | $116,000 | |
| Closed | Briggs Charles L | $116,000 | |
| Previous Owner | Briggs Charles L | $48,800 |
Source: Public Records
Tax History Compared to Growth
Tax History
| Year | Tax Paid | Tax Assessment Tax Assessment Total Assessment is a certain percentage of the fair market value that is determined by local assessors to be the total taxable value of land and additions on the property. | Land | Improvement |
|---|---|---|---|---|
| 2025 | $2,176 | $130,200 | $23,000 | $107,200 |
| 2024 | $2,715 | $158,400 | $21,000 | $137,400 |
| 2023 | $2,666 | $150,900 | $30,500 | $120,400 |
| 2022 | $2,609 | $140,800 | $30,500 | $110,300 |
| 2021 | $2,425 | $130,300 | $28,200 | $102,100 |
| 2020 | $2,316 | $124,400 | $26,900 | $97,500 |
| 2019 | $2,322 | $121,500 | $27,500 | $94,000 |
| 2018 | $2,200 | $124,700 | $29,500 | $95,200 |
| 2017 | $2,182 | $123,500 | $29,200 | $94,300 |
| 2016 | $2,148 | $123,500 | $29,200 | $94,300 |
| 2015 | $2,246 | $134,600 | $30,200 | $104,400 |
Source: Public Records
Map
Nearby Homes
- 299 E Main St
- 10 Miner St
- 132 E Quincy St
- 30 Dover St
- 31 Dover St
- 77 Front St
- 57 Beacon St
- 11-15 Perry St
- 50 Gallup St
- 101 Prospect St
- 35 Jackson St
- 19 N Church St Unit 12
- 19 N Church St Unit 14
- 19 N Church St Unit 11
- 19 N Church St Unit 7
- 0 Church St
- 23-27 Gallup St
- 380 Union St
- 15 Murray Ave
- 38 Wesleyan St
- 67-69 E Quincy St
- 59 E Quincy St
- 75 E Quincy St
- 53 E Quincy St
- 316 E Main St
- 79 E Quincy St
- 324 E Main St
- 324 E Main St Unit 2
- 83 E Quincy St
- 70 E Quincy St
- 49 E Quincy St
- 76 E Quincy St
- 330 E Main St
- 308 E Main St
- 87 E Quincy St
- 60 E Quincy St
- 82 E Quincy St
- 304 E Main St
- 332 E Main St
- 52 E Quincy St