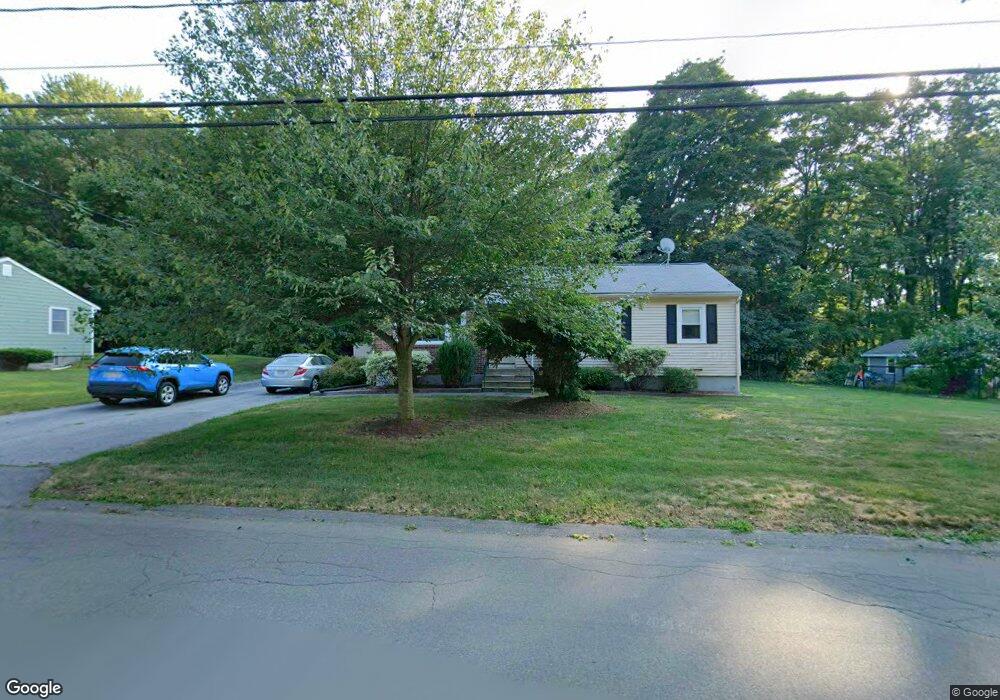
67 Edsel Rd Littleton, MA 01460
Littleton Common NeighborhoodEstimated Value: $512,000 - $560,000
3
Beds
2
Baths
1,345
Sq Ft
$404/Sq Ft
Est. Value
About This Home
This home is located at 67 Edsel Rd, Littleton, MA 01460 and is currently estimated at $543,214, approximately $403 per square foot. 67 Edsel Rd is a home located in Middlesex County with nearby schools including Shaker Lane Elementary School, Russell Street Elementary School, and Littleton Middle School.
Ownership History
Date
Name
Owned For
Owner Type
Purchase Details
Closed on
May 29, 2013
Sold by
Est Bentle Clarence J and Bentle Michael C
Bought by
Bentle Michael C and Brackett Betsey A
Current Estimated Value
Purchase Details
Closed on
Sep 16, 2003
Sold by
Bentle Barbara A and Bentle Clarence J
Bought by
Bentle Clarence J
Create a Home Valuation Report for This Property
The Home Valuation Report is an in-depth analysis detailing your home's value as well as a comparison with similar homes in the area
Home Values in the Area
Average Home Value in this Area
Purchase History
| Date | Buyer | Sale Price | Title Company |
|---|---|---|---|
| Bentle Michael C | -- | -- | |
| Bentle Clarence J | -- | -- |
Source: Public Records
Tax History
| Year | Tax Paid | Tax Assessment Tax Assessment Total Assessment is a certain percentage of the fair market value that is determined by local assessors to be the total taxable value of land and additions on the property. | Land | Improvement |
|---|---|---|---|---|
| 2025 | $67 | $451,700 | $203,800 | $247,900 |
| 2024 | $6,406 | $431,700 | $203,800 | $227,900 |
| 2023 | $6,154 | $378,700 | $194,500 | $184,200 |
| 2022 | $6,190 | $349,500 | $194,500 | $155,000 |
| 2021 | $5,883 | $332,400 | $183,400 | $149,000 |
| 2020 | $5,356 | $301,400 | $155,400 | $146,000 |
| 2019 | $5,100 | $279,600 | $131,800 | $147,800 |
| 2018 | $4,959 | $273,400 | $135,200 | $138,200 |
| 2017 | $4,772 | $262,900 | $128,400 | $134,500 |
| 2016 | $4,651 | $262,900 | $128,400 | $134,500 |
| 2015 | $4,597 | $254,000 | $111,500 | $142,500 |
Source: Public Records
Map
Nearby Homes
- 20 Shattuck St
- 14 Robinson Rd Unit 2
- 18 Long Lake Rd
- 17 Hartwell Ave
- 146 Tahattawan Rd
- 35 Queen Rd
- 19 Ipswich Dr
- 28 Springfield Dr
- 305 Harwood Ave
- Lot 1 & 3 Beaver Brook Rd
- 84 Powers Rd
- 5 Kimball St
- 76 Beaver Brook Rd
- 11-15 Taylor St
- 3 Taylor St
- 119 Taylor St
- 4 Omega Way
- 91 Jimney Dr Unit 91
- 18 Mcintosh Ln
- 0 Ayer Rd
Your Personal Tour Guide
Ask me questions while you tour the home.