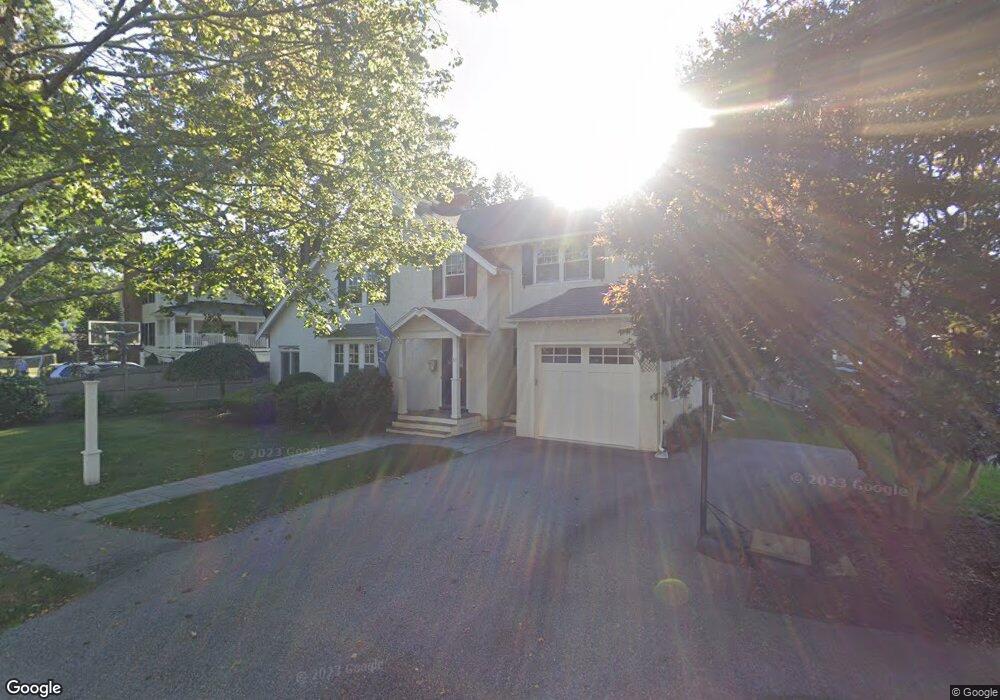
67 Ellicott St Needham, MA 02492
Estimated Value: $1,415,000 - $1,551,000
4
Beds
4
Baths
1,300
Sq Ft
$1,130/Sq Ft
Est. Value
About This Home
This home is located at 67 Ellicott St, Needham, MA 02492 and is currently estimated at $1,469,190, approximately $1,130 per square foot. 67 Ellicott St is a home located in Norfolk County with nearby schools including Mitchell Elementary School, High Rock Middle School, and Pollard Middle School.
Ownership History
Date
Name
Owned For
Owner Type
Purchase Details
Closed on
Jul 15, 2003
Sold by
Ritson Michael B and Colby Anne F
Bought by
Thress Kenneth S and Thress Meghan R
Current Estimated Value
Purchase Details
Closed on
Dec 1, 1995
Sold by
Yanovsky Ilya
Bought by
Ritson Michael B
Purchase Details
Closed on
Jul 21, 1995
Sold by
Est Cooke Karen J
Bought by
Yanovsky Ilya
Create a Home Valuation Report for This Property
The Home Valuation Report is an in-depth analysis detailing your home's value as well as a comparison with similar homes in the area
Home Values in the Area
Average Home Value in this Area
Purchase History
| Date | Buyer | Sale Price | Title Company |
|---|---|---|---|
| Thress Kenneth S | $571,000 | -- | |
| Ritson Michael B | $248,000 | -- | |
| Yanovsky Ilya | $180,000 | -- |
Source: Public Records
Mortgage History
| Date | Status | Borrower | Loan Amount |
|---|---|---|---|
| Open | Yanovsky Ilya | $412,000 | |
| Closed | Yanovsky Ilya | $225,000 |
Source: Public Records
Tax History
| Year | Tax Paid | Tax Assessment Tax Assessment Total Assessment is a certain percentage of the fair market value that is determined by local assessors to be the total taxable value of land and additions on the property. | Land | Improvement |
|---|---|---|---|---|
| 2025 | $12,311 | $1,161,400 | $773,900 | $387,500 |
| 2024 | $12,570 | $1,004,000 | $562,100 | $441,900 |
| 2023 | $12,676 | $972,100 | $562,100 | $410,000 |
| 2022 | $12,236 | $915,200 | $520,400 | $394,800 |
| 2021 | $11,925 | $915,200 | $520,400 | $394,800 |
| 2020 | $11,582 | $927,300 | $521,300 | $406,000 |
| 2019 | $10,845 | $875,300 | $473,900 | $401,400 |
| 2018 | $10,399 | $875,300 | $473,900 | $401,400 |
| 2017 | $9,776 | $822,200 | $473,900 | $348,300 |
| 2016 | $9,057 | $784,800 | $473,900 | $310,900 |
| 2015 | $8,860 | $784,800 | $473,900 | $310,900 |
| 2014 | $8,312 | $714,100 | $412,000 | $302,100 |
Source: Public Records
Map
Nearby Homes
- 36 Otis St Unit 36
- 31 Birds Hill Ave
- 176 Highgate St
- 190 Brookline St
- 638 Webster St
- 638 Webster St Unit 638
- 126 Prince St
- 100 Bradford St
- 68 Brookline St
- 17 Lindbergh Ave
- 19 Oakland Ave Unit 19
- 971 Webster St
- 19 Highland Ct Unit 19
- 233 Warren St
- 68 Pleasant St Unit 68
- 510 Webster St
- 1011 Webster St
- 60 Sutton Rd
- 193 Garden St
- 58 Morton St
- 59 Ellicott St
- 73 Sargent St
- 77 Sargent St
- 76 Ellicott St
- 76 Ellicott St Unit 1
- 66 Ellicott St
- 51 Ellicott St
- 60 Ellicott St
- 150 Melrose Ave
- 146 Melrose Ave
- 56 Ellicott St
- 56 Ellicott St Unit 56
- 56 Ellicott St Unit 2
- 158 Melrose Ave
- 55 Sargent St
- 138 Melrose Ave
- 47 Ellicott St
- 72 Sargent St
- 52 Ellicott St
- 134 Melrose Ave
Your Personal Tour Guide
Ask me questions while you tour the home.