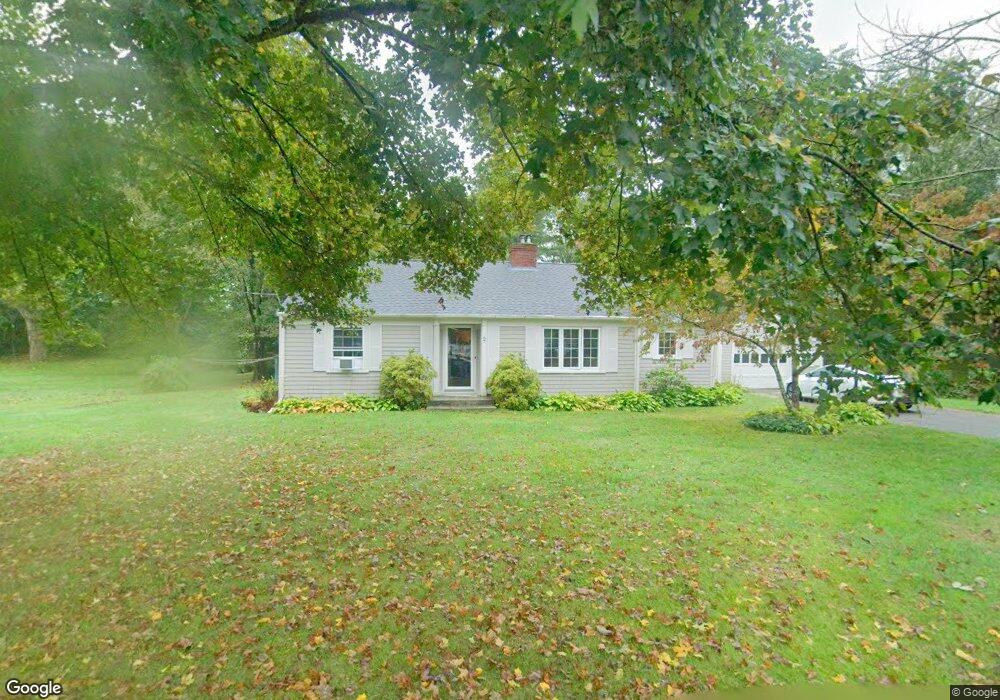
67 Elm St Rehoboth, MA 02769
Estimated Value: $510,674 - $581,000
2
Beds
2
Baths
1,355
Sq Ft
$404/Sq Ft
Est. Value
About This Home
This home is located at 67 Elm St, Rehoboth, MA 02769 and is currently estimated at $546,891, approximately $403 per square foot. 67 Elm St is a home located in Bristol County with nearby schools including Dighton-Rehoboth Regional High School and Cedar Brook School.
Ownership History
Date
Name
Owned For
Owner Type
Purchase Details
Closed on
Apr 5, 2021
Sold by
Gustafson Ingrid C
Bought by
Gustafson Greta S
Current Estimated Value
Purchase Details
Closed on
Aug 29, 2005
Sold by
Crowther Lois J and Marler Ingrid C
Bought by
Gustafson Ingrid C
Home Financials for this Owner
Home Financials are based on the most recent Mortgage that was taken out on this home.
Original Mortgage
$125,000
Interest Rate
5.68%
Mortgage Type
Purchase Money Mortgage
Create a Home Valuation Report for This Property
The Home Valuation Report is an in-depth analysis detailing your home's value as well as a comparison with similar homes in the area
Home Values in the Area
Average Home Value in this Area
Purchase History
| Date | Buyer | Sale Price | Title Company |
|---|---|---|---|
| Gustafson Greta S | -- | None Available | |
| Gustafson Ingrid C | $325,000 | -- |
Source: Public Records
Mortgage History
| Date | Status | Borrower | Loan Amount |
|---|---|---|---|
| Previous Owner | Gustafson Ingrid C | $125,000 |
Source: Public Records
Tax History
| Year | Tax Paid | Tax Assessment Tax Assessment Total Assessment is a certain percentage of the fair market value that is determined by local assessors to be the total taxable value of land and additions on the property. | Land | Improvement |
|---|---|---|---|---|
| 2025 | $49 | $438,600 | $201,400 | $237,200 |
| 2024 | $4,482 | $394,500 | $192,800 | $201,700 |
| 2023 | $4,280 | $377,800 | $188,800 | $189,000 |
| 2022 | $4,280 | $337,800 | $180,400 | $157,400 |
| 2021 | $4,340 | $305,700 | $164,100 | $141,600 |
| 2020 | $3,866 | $294,700 | $164,100 | $130,600 |
| 2018 | $3,475 | $290,300 | $156,300 | $134,000 |
| 2017 | $6,248 | $260,400 | $156,300 | $104,100 |
| 2016 | $3,204 | $263,700 | $156,300 | $107,400 |
| 2015 | $2,823 | $229,300 | $149,100 | $80,200 |
| 2014 | $2,763 | $222,100 | $141,900 | $80,200 |
Source: Public Records
Map
Nearby Homes
- 248 County
- 321 Winthrop St
- 23 Bay State Rd
- 145 Winthrop St
- 111 Summer St
- 0 Winthrop St Unit 73180872
- 20 School St
- 8 Linden Ln
- 8 Linden Ln
- 185 Moulton St
- 349 Anawan St
- 197 Chestnut St
- 133 Winthrop St
- 42 Linden Ln
- 15 Hickory Ridge Rd
- 10 Muriel Way
- 24 Danforth St
- 46 Mikayla Ann Dr
- 0 Winter St
- 23 Colonial Way
Your Personal Tour Guide
Ask me questions while you tour the home.