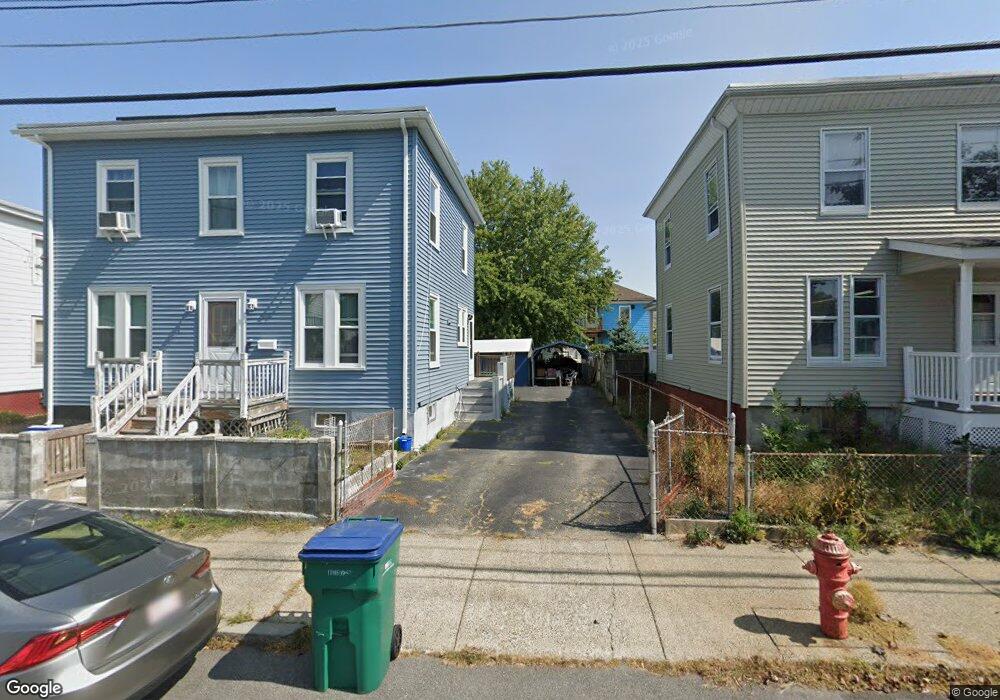
67 Flint St Lynn, MA 01905
Lower Boston Street NeighborhoodEstimated Value: $462,000 - $620,000
4
Beds
2
Baths
1,586
Sq Ft
$359/Sq Ft
Est. Value
About This Home
This home is located at 67 Flint St, Lynn, MA 01905 and is currently estimated at $568,884, approximately $358 per square foot. 67 Flint St is a home located in Essex County with nearby schools including North Park Elementary School, William R. Fallon School, and Lincoln-Thomson Elementary School.
Ownership History
Date
Name
Owned For
Owner Type
Purchase Details
Closed on
May 22, 1998
Sold by
67 Flint Street Rt and Connor Paul M
Bought by
Pouv Chenda and In Chanary
Current Estimated Value
Purchase Details
Closed on
Apr 12, 1996
Sold by
Frost Robyn N and Frost Sandra
Bought by
67 Flint Street Rt and Moison Robert C
Create a Home Valuation Report for This Property
The Home Valuation Report is an in-depth analysis detailing your home's value as well as a comparison with similar homes in the area
Home Values in the Area
Average Home Value in this Area
Purchase History
| Date | Buyer | Sale Price | Title Company |
|---|---|---|---|
| Pouv Chenda | $130,000 | -- | |
| Pouv Chenda | $130,000 | -- | |
| 67 Flint Street Rt | $31,000 | -- | |
| 67 Flint Street Rt | $31,000 | -- |
Source: Public Records
Mortgage History
| Date | Status | Borrower | Loan Amount |
|---|---|---|---|
| Open | 67 Flint Street Rt | $127,650 | |
| Closed | 67 Flint Street Rt | $145,000 | |
| Closed | 67 Flint Street Rt | $134,000 |
Source: Public Records
Tax History Compared to Growth
Tax History
| Year | Tax Paid | Tax Assessment Tax Assessment Total Assessment is a certain percentage of the fair market value that is determined by local assessors to be the total taxable value of land and additions on the property. | Land | Improvement |
|---|---|---|---|---|
| 2025 | $5,845 | $564,200 | $225,700 | $338,500 |
| 2024 | $5,353 | $508,400 | $198,300 | $310,100 |
| 2023 | $5,106 | $457,900 | $204,800 | $253,100 |
| 2022 | $4,854 | $390,500 | $151,600 | $238,900 |
| 2021 | $4,620 | $354,600 | $139,400 | $215,200 |
| 2020 | $4,481 | $334,400 | $134,200 | $200,200 |
| 2019 | $4,279 | $299,200 | $126,400 | $172,800 |
| 2018 | $4,425 | $292,100 | $139,400 | $152,700 |
| 2017 | $4,126 | $264,500 | $115,900 | $148,600 |
| 2016 | $3,961 | $244,800 | $108,500 | $136,300 |
| 2015 | $3,806 | $227,200 | $107,600 | $119,600 |
Source: Public Records
Map
Nearby Homes